RSIインジケーターに基づく長期トレンドフォロー戦略
作成日:
2023-12-25 14:32:19
最終変更日:
2023-12-25 14:32:19
コピー:
2
クリック数:
736
1
フォロー
1751
フォロワー
概要
この戦略は,相対的に強い指数 ((RSI)) の指標設計に基づいて,RSIの低点の買入,高点のストップ・ロスの多頭トレンドを追跡する取引戦略である. RSIの指標が超買線を下回ると買入シグナルを生成し,RSIの指標が超売線上回ると売り出シグナルを生成する. 戦略は,トレンドを追跡するパフォーマンスを最適化し,取引リスクを効果的に制御することができる.
戦略原則
この戦略は,株価が過大評価されているか過小評価されているかを判断するために,RSI指標を使用する. RSI指標は,超買超売ラインを上回り,購入と販売のシグナルを形成する.具体的には,RSI指標の上で20の超売ラインを突破した場合,購入のシグナルを生じ;RSI指標の下に80の超買ラインを突破した場合,販売のシグナルを生じする.
多頭ポジションに入ると,戦略は,下行リスクを制御するために最初のストップラインを設定する.同時に,異なる割合の2つのストップラインを設定し,利益をロックするためにストップを区切る.具体的には,最初に50%のポジションをストップし,ストップ価格は購入価格の3%;その後,残りの50%のポジションをストップし,ストップ価格は購入価格の5%である.
この戦略は,RSI指標を簡潔かつ効果的に利用して,入場のタイミングを判断する. ストップ・ストップ・ロスの設定は合理的で,リスクを効果的に制御する.
戦略的優位性
- RSIを活用して空白を判断し,盲目な余分な作業を避ける
- RSI指標のパラメータが最適化され,指標の効果が向上しました.
- 双ストップストップの設計は合理的で,分批ストップを実現し,より多くの利益をロックします.
- 初期停止と連続停止は,大きな損失を防ぐ
リスク分析
- 複数の戦略で,持続的に利益を得られない牛市は,うまくいかない.
- RSI指標が誤った信号を発する確率は存在し,誤った信号判断は損失を増やす可能性があります.
- ストップポイントが深すぎると ストップできないリスクが生じます
- 貯蓄の回数と割合の制限がなくなり,損失が拡大する可能性がある.
最適化の方向
- 他の指標と組み合わせてRSI信号をフィルタリングし,信号の正確性を向上させる
- 追加された加減回数と割合の制限
- 異なるRSIパラメータの効果をテスト
- ストップポイントを最適化してリスクを低減する
要約する
この戦略は,RSI指標を用いて状況を判断し,ストップ・ストップ・ロスの設定は合理的である.トレンドを効果的に判断し,取引リスクを制御し,多頭追跡戦略として使用するのに適している.信号フィルタリング,パラメータテスト,ストップ・ロスの最適化などの方法によって戦略の安定性をさらに向上させることができる.
ストラテジーソースコード
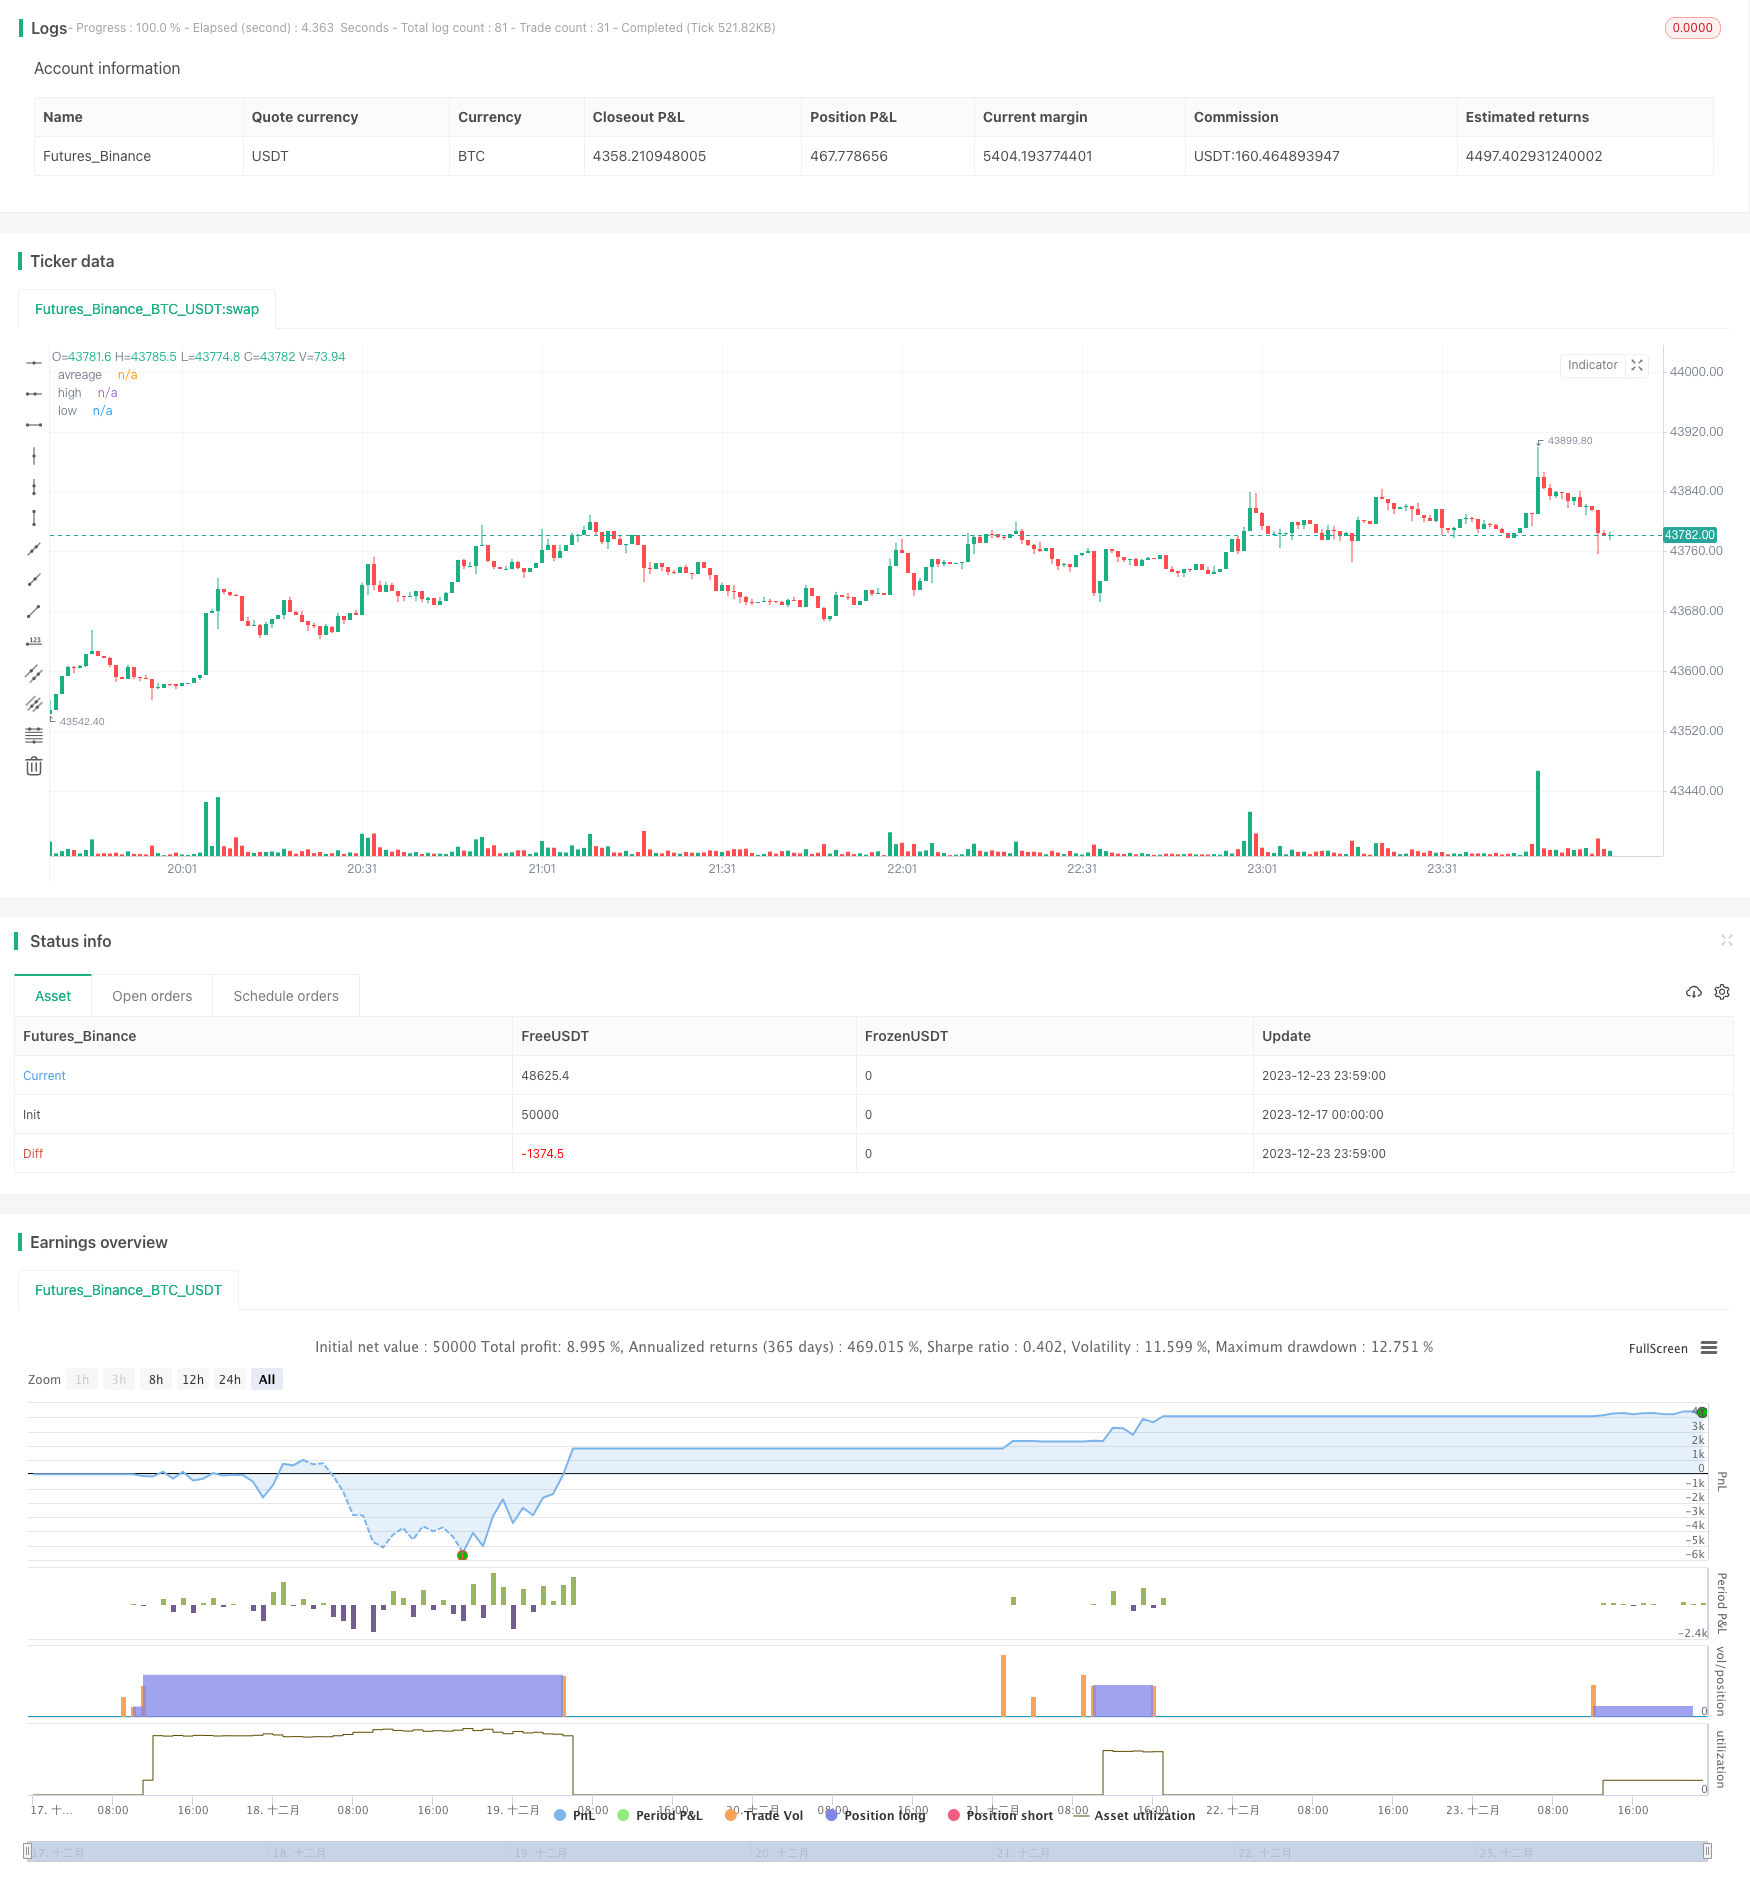
/*backtest
start: 2023-12-17 00:00:00
end: 2023-12-24 00:00:00
period: 1m
basePeriod: 1m
exchanges: [{"eid":"Futures_Binance","currency":"BTC_USDT"}]
*/

// This source code is subject to the terms of the Mozilla Public License 2.0 at https://mozilla.org/MPL/2.0/

//@version=5

strategy(title='RSI Long Strategy', overlay=true, pyramiding=5, initial_capital=10000, default_qty_type=strategy.percent_of_equity, default_qty_value=100, calc_on_order_fills=false, slippage=0, commission_type=strategy.commission.percent, commission_value=0.075)
strat_dir_input = input.string(title='Strategy Direction', defval='long', options=['long', 'short', 'all'])
strat_dir_value = strat_dir_input == 'long' ? strategy.direction.long : strat_dir_input == 'short' ? strategy.direction.short : strategy.direction.all
strategy.risk.allow_entry_in(strat_dir_value)
//INPUTS


length = input(21)
overSold = input(20)
overBought = input(80)
p = close

vrsi = ta.rsi(p, length)
price = close
var bool long = na
var bool short = na

long := ta.crossover(vrsi, overSold)
short := ta.crossunder(vrsi, overBought)

var float last_open_long = na
var float last_open_short = na

last_open_long := long ? close : nz(last_open_long[1])
last_open_short := short ? close : nz(last_open_short[1])
mpoint=(last_open_long+last_open_short)/2

entry_value = last_open_long
entry_value1 = last_open_short

// Rounding levels to min tick
nround(x) =>
    n = math.round(x / syminfo.mintick) * syminfo.mintick
    n
//
disp_panels = input(true, title='Display info panels?')
fibs_label_off = input(40, title='fibs label offset')
fibs_label_size = input.string(size.normal, options=[size.tiny, size.small, size.normal, size.large, size.huge], title='fibs label size')
r1_x = timenow + math.round(ta.change(time) * fibs_label_off)
r1_y = last_open_short
text1 = 'High : ' + str.tostring(nround(last_open_short))
s1_y = last_open_long
text3 = 'low : ' + str.tostring(nround(last_open_long))

R1_label = disp_panels ? label.new(x=r1_x, y=r1_y, text=text1, xloc=xloc.bar_time, yloc=yloc.price, color=color.orange, style=label.style_label_down, textcolor=color.black, size=fibs_label_size) : na
S1_label = disp_panels ? label.new(x=r1_x, y=s1_y, text=text3, xloc=xloc.bar_time, yloc=yloc.price, color=color.lime, style=label.style_label_up, textcolor=color.black, size=fibs_label_size) : na

label.delete(R1_label[1])
label.delete(S1_label[1])
//
plot(mpoint, title='avreage', color=color.new(color.red, 40), style=plot.style_linebr, linewidth=3, trackprice=true, offset=-9999)
plot(last_open_short, title='high', color=color.new(color.red, 40), style=plot.style_linebr, linewidth=3, trackprice=true, offset=-9999)
plot(last_open_long, title='low', color=color.new(color.blue, 40), style=plot.style_linebr, linewidth=3, trackprice=true, offset=-9999)
//
trend = input(false)
if barstate.islast and trend == true
    line z = line.new(bar_index[1], last_open_short[1], bar_index, last_open_short, extend=extend.both, color=color.red, style=line.style_dashed, width=1)
    line f = line.new(bar_index[1], mpoint[1], bar_index, mpoint, extend=extend.both, color=color.blue, style=line.style_dashed, width=1)
    line w = line.new(bar_index[1], last_open_long[1], bar_index, last_open_long, extend=extend.both, color=color.green, style=line.style_dashed, width=1)
    line.delete(z[1])
    line.delete(f[1])
    line.delete(w[1])

//bu = ta.crossover(close, mpoint)
//sz = ta.crossunder(close, mpoint)
//bu1 = ta.crossover(close, last_open_short)
sz1 = ta.crossunder(close, last_open_short)
bu2 = ta.crossover(close, last_open_long)
//sz2 = ta.crossunder(close, last_open_long)
//plotshape(sz, style=shape.triangledown, location=location.abovebar, color=color.new(color.orange, 0), size=size.tiny)
//plotshape(bu, style=shape.triangleup, location=location.belowbar, color=color.new(color.blue, 0), size=size.tiny)
//plotshape(sz1, style=shape.triangledown, location=location.abovebar, color=color.new(color.red, 0), size=size.tiny)
//plotshape(bu1, style=shape.triangleup, location=location.belowbar, color=color.new(color.green, 0), size=size.tiny)
//plotshape(sz2, style=shape.triangledown, location=location.abovebar, color=color.new(color.red, 0), size=size.tiny)
//plotshape(bu2, style=shape.triangleup, location=location.belowbar, color=color.new(color.green, 0), size=size.tiny)

l = bu2
s = sz1
if l
    strategy.entry('buy', strategy.long)
if s
    strategy.entry('sell', strategy.short)
per(pcnt) =>
    strategy.position_size != 0 ? math.round(pcnt / 100 * strategy.position_avg_price / syminfo.mintick) : float(na)
stoploss = input.float(title=' stop loss', defval=5, minval=0.01)
los = per(stoploss)
q1 = input.int(title=' qty_percent1', defval=50, minval=1)
q2 = input.int(title=' qty_percent2', defval=50, minval=1)
tp1 = input.float(title=' Take profit1', defval=3, minval=0.01)
tp2 = input.float(title=' Take profit2', defval=5, minval=0.01)
//tp4 = input.float(title=' Take profit4', defval=5, minval=0.01)
strategy.exit('x1', qty_percent=q1, profit=per(tp1), loss=los)
strategy.exit('x2', qty_percent=q2, profit=per(tp2), loss=los)