EMAクロスオーバーに基づくトレンド反転取引戦略
作成日:
2023-12-25 15:12:46
最終変更日:
2023-12-25 15:12:46
コピー:
1
クリック数:
742
1
フォロー
1750
フォロワー
概要
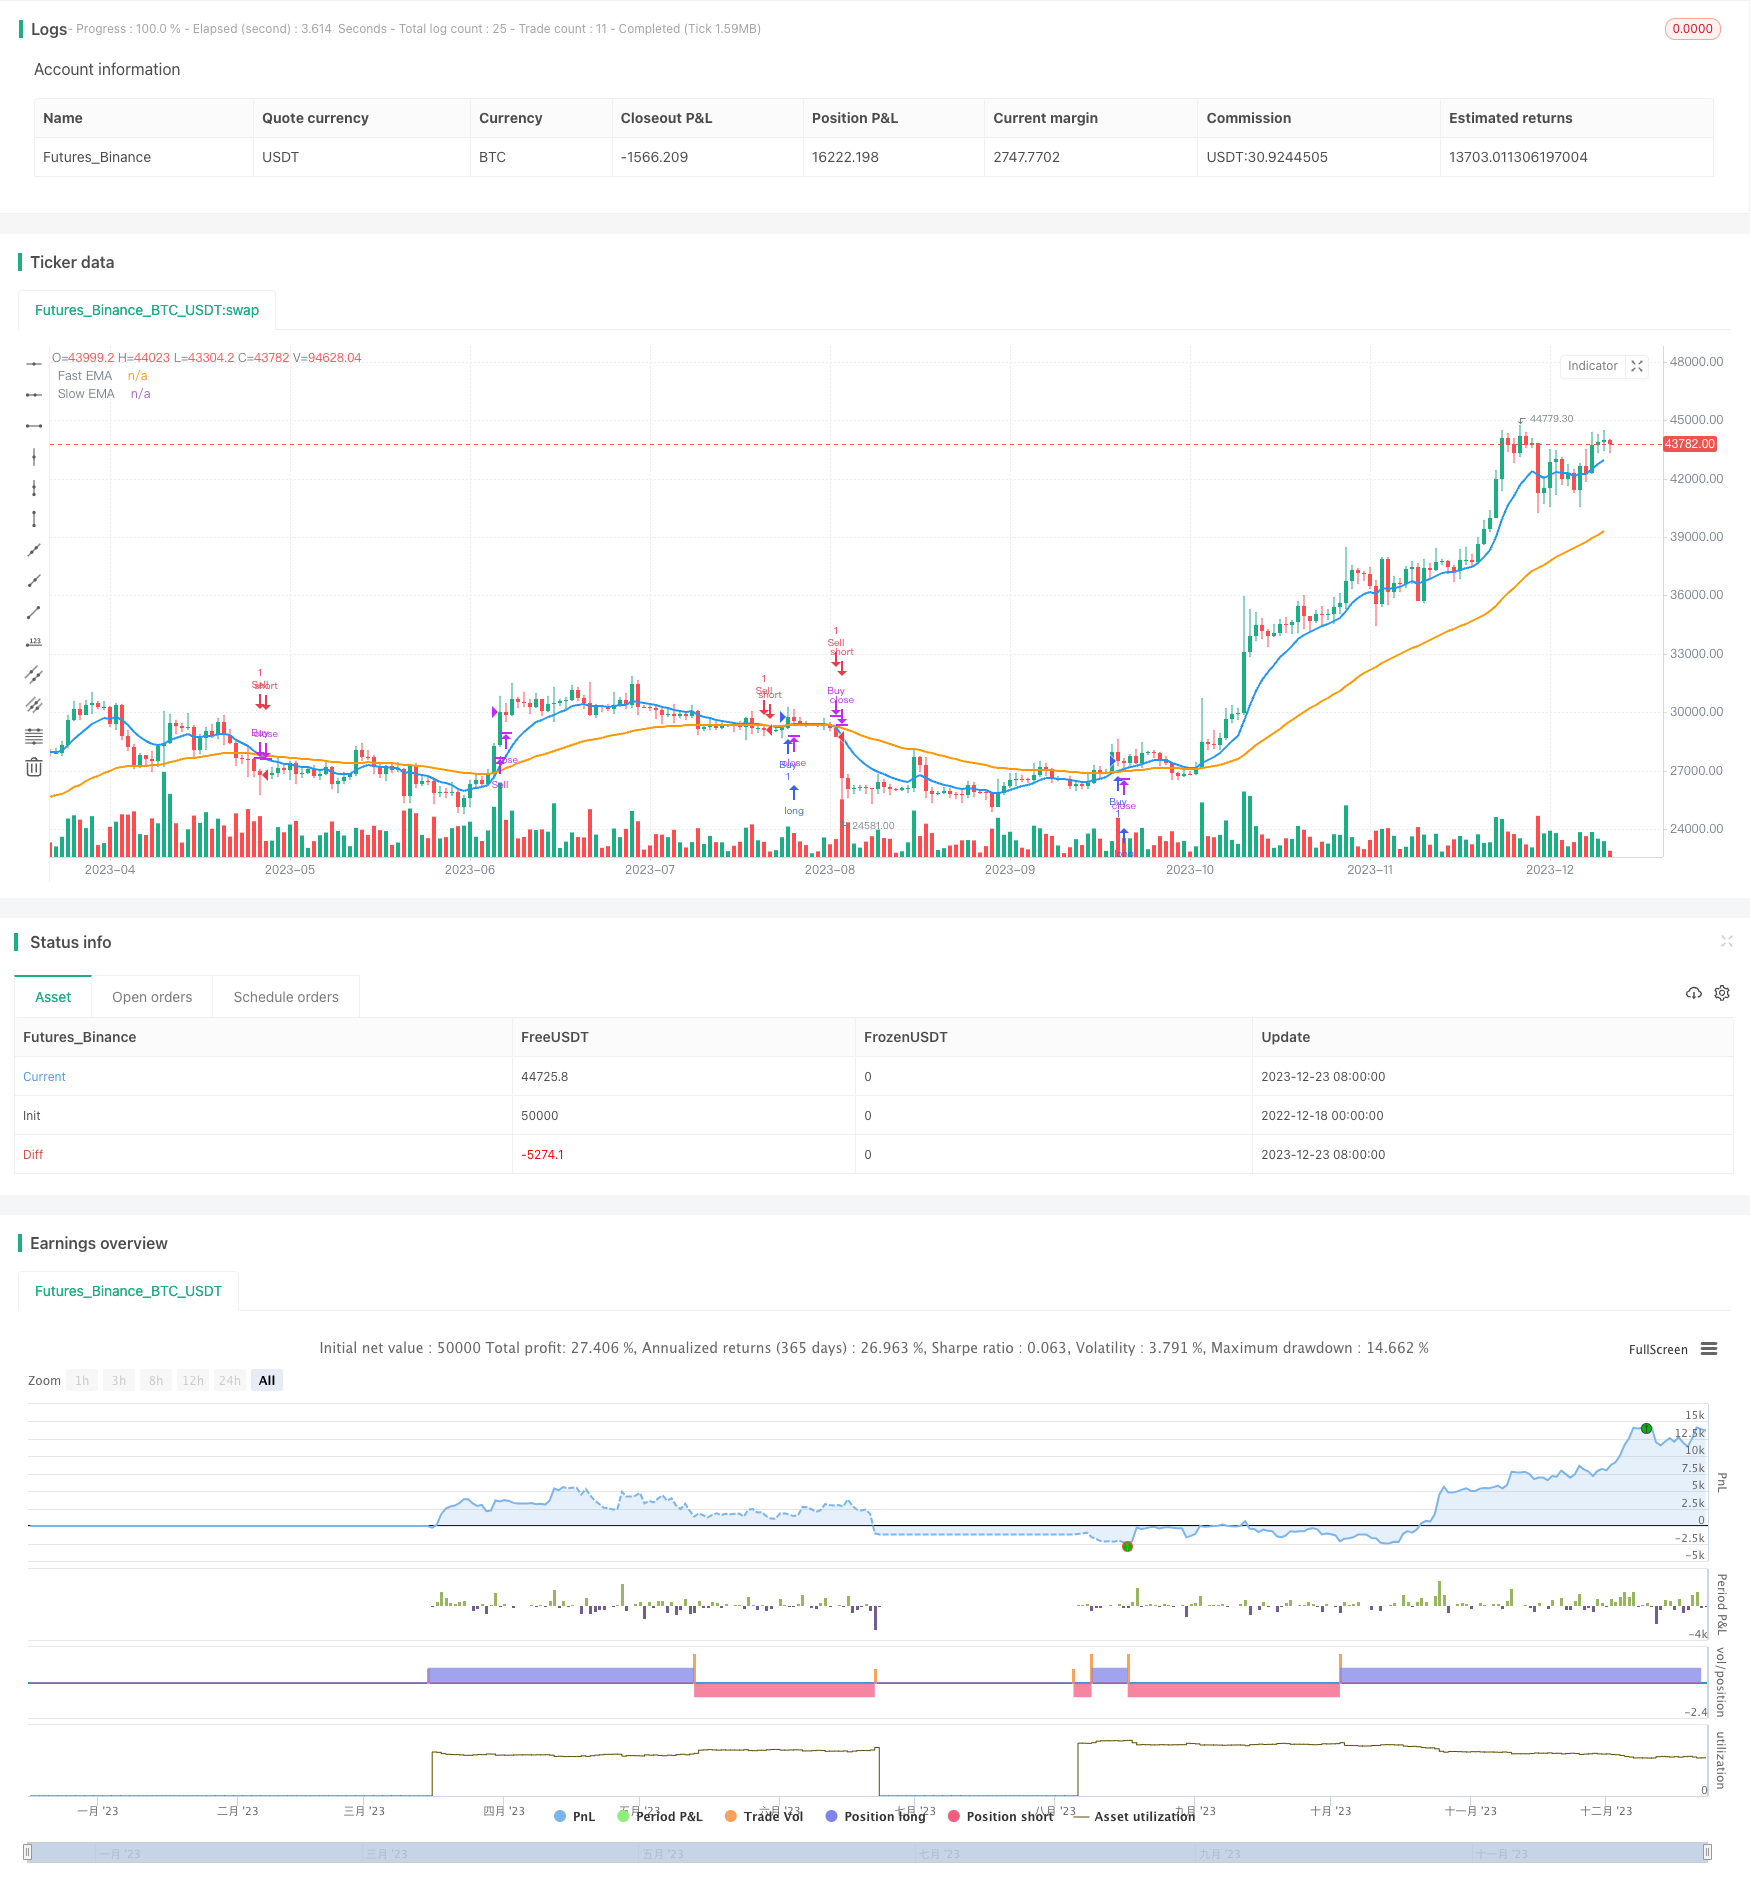
この戦略は,高速EMA周期と遅いEMA周期の指数移動平均を計算し,グラフに描画し,その交差点をリアルタイムで監視し,価格トレンドの転換を判断する. RSIと結合して,超買超売指標を回避して,偽信号を出し,取引信号を形成する. 急速EMAが上昇して遅いEMAを突破すると,買い信号が生じる. 急速EMAが低下して遅いEMAを突破すると,売り信号が生じる.
戦略原則
- 急速EMA周期と遅いEMA周期の指数移動平均を計算
- 交差点をリアルタイムで グラフに描画する
- 急速EMAが上向きに緩慢EMAを突破すると,上昇傾向として判断され,買い信号が形成されます.
- 急速なEMAは下方へ下落し,ゆっくりとしたEMAを破ると下降傾向として判断され,セールシグナルを形成する.
- RSIと組み合わせた偽信号を避ける
- トレンドフィルター条件を設定し,トレンドが変化したときにのみ取引します.
優位分析
- EMAでトレンド転換を判断し,小幅の変動に敏感ではない
- RSIのフィルタリングは,反転の偽信号を回避します.
- EMAサイクルとRSIパラメータをカスタマイズして,異なる市場に対応
- コードは直感的で簡潔で理解しやすい
リスク分析
- EMAは後退しており,転換点を見逃している可能性がある
- EMAの判断は,大きな波動の中,失効した.
- EMAパラメータとRSIパラメータを適切に調整する必要があります.
- 他の指標と組み合わせることができる検証信号
最適化の方向
- 他の指標と組み合わせた検証信号の決定度
- ストップ・ストップ・ストラテジックのリスクの増強
- 異なる周期パラメータの安定性をテストする
- 通貨強度指数を増やし,通貨リスクを回避する
- 取引コストの最適化と収益率を考慮する
要約する
この戦略の全体的な考え方は明確で,EMAの判断トレンド転換を使用し,RSI指標のフィルタリング信号と組み合わせて,中長線トレンドを効果的に捕捉できます.しかし,EMAとRSIのパラメータの調整と止損戦略は,まだ最適化する必要があります.そして,反転点と振動市場を逃すリスクに直面しています.パラメータの最適化とリスクが制御されている場合,この戦略は,中長線トレンドの転向点を発見し,投資決定を作成するために使用できます.
ストラテジーソースコード
/*backtest
start: 2022-12-18 00:00:00
end: 2023-12-24 00:00:00
period: 1d
basePeriod: 1h
exchanges: [{"eid":"Futures_Binance","currency":"BTC_USDT"}]
*/

//@version=5
strategy("Trend Change with EMA Entry/Exit - Intraday", overlay=true)

// Define the fast and slow EMA periods
fast_ema_period = input(10, title="Fast EMA Period")
slow_ema_period = input(50, title="Slow EMA Period")

// Calculate the EMAs
ema_fast = ta.ema(close, fast_ema_period)
ema_slow = ta.ema(close, slow_ema_period)

// Plot the EMAs on the chart
plot(ema_fast, title="Fast EMA", color=color.blue, linewidth=2)
plot(ema_slow, title="Slow EMA", color=color.orange, linewidth=2)

// Detect trend changes (crossovers and crossunders)
is_uptrend = ta.crossover(ema_fast, ema_slow)
is_downtrend = ta.crossunder(ema_fast, ema_slow)

// Relative Strength Index (RSI)
rsi_length = input(14, title="RSI Length")
overbought_level = input(70, title="Overbought Level")
oversold_level = input(30, title="Oversold Level")
rsi_value = ta.rsi(close, rsi_length)

// Trend Filter
is_trending = ta.change(is_uptrend) != 0 or ta.change(is_downtrend) != 0

// Entry and Exit signals
enter_long = is_uptrend and rsi_value < overbought_level and is_trending
exit_long = is_downtrend and is_trending
enter_short = is_downtrend and rsi_value > oversold_level and is_trending
exit_short = is_uptrend and is_trending

strategy.entry("Buy", strategy.long, when=enter_long)
strategy.close("Buy", when=exit_long)
strategy.entry("Sell", strategy.short, when=enter_short)
strategy.close("Sell", when=exit_short)