ボリンジャーバンド下方クロスオーバーRSIプルバック取引戦略
作成日:
2023-12-26 12:08:44
最終変更日:
2023-12-26 12:08:44
コピー:
1
クリック数:
676
1
フォロー
1750
フォロワー
概要
この戦略は,ブリン帯の指標を用いて,価格が超買超売領域に入っているかどうかを判断し,RSI指標と組み合わせて,超買領域がデッドフォークを形成するときに空き場を作って,価格がブリン帯の軌道を超えたときに止まる.
戦略原則
この戦略は以下の原則に基づいています.
- 閉盤価格がブリン帯を上から横断すると,資産が超買い領域に入り,リターンチャンスがあることを示します.
- RSIは,超買いと超売り領域を有効に判断します. RSI>70は超買い領域です.
- 閉盤価格が上から下を突破したときに空頭ポジションを取ります
- RSIが超買区から下がったり,ストップポイントを触発すると,平仓ストップ
優位分析
この戦略の利点は以下の通りです.
- ブリン帯は,取引の成功率を向上させるため,超買超売の領域を判断します.
- RSIは偽の突破を回避するために,偽の突破を回避するために,偽の突破を回避するために,偽の突破を回避するために,偽の突破を回避するために,偽の突破を回避するために,偽の突破を回避するために,偽の突破を回避するために.
- 利益比が高く,リスクが最大限に抑えられる
リスク分析
この戦略には以下のリスクがあります.
- 破線後の上昇は,損失の拡大につながった.
- RSIがタイムリーに下がれず,損失はさらに拡大
- 単方面保有で,取引できない.
リスクは以下の方法で軽減できます.
- ストップポイントを適正に調整し,タイムリーにストップします.
- RSIの逆転信号を判断する他の指標の組み合わせ
- 平均線指数と組み合わせて,収束を判断する
最適化の方向
この戦略は以下の点で最適化できます.
- ブリン帯のパラメータを最適化し,より多くの取引品種に対応
- RSIパラメータを最適化して指標の効果を向上させる
- 他の指標の組み合わせを加え,トレンドの転換点を判断する
- 多頭取引の論理を追加
- ストップ・ストップ戦略とストップ・ポイントの動的調整
要約する
この戦略は,全体として,典型的な超買区の急速ショートライン取引戦略である. ブリン帯を利用して,買賣点を判断し,RSIフィルター信号. 合理的なストップを介してリスクレベルを制御する. パラメータ最適化,コンポーネント指標,ポジション開設論理の追加などによって効果を向上させることができる.
ストラテジーソースコード
/*backtest
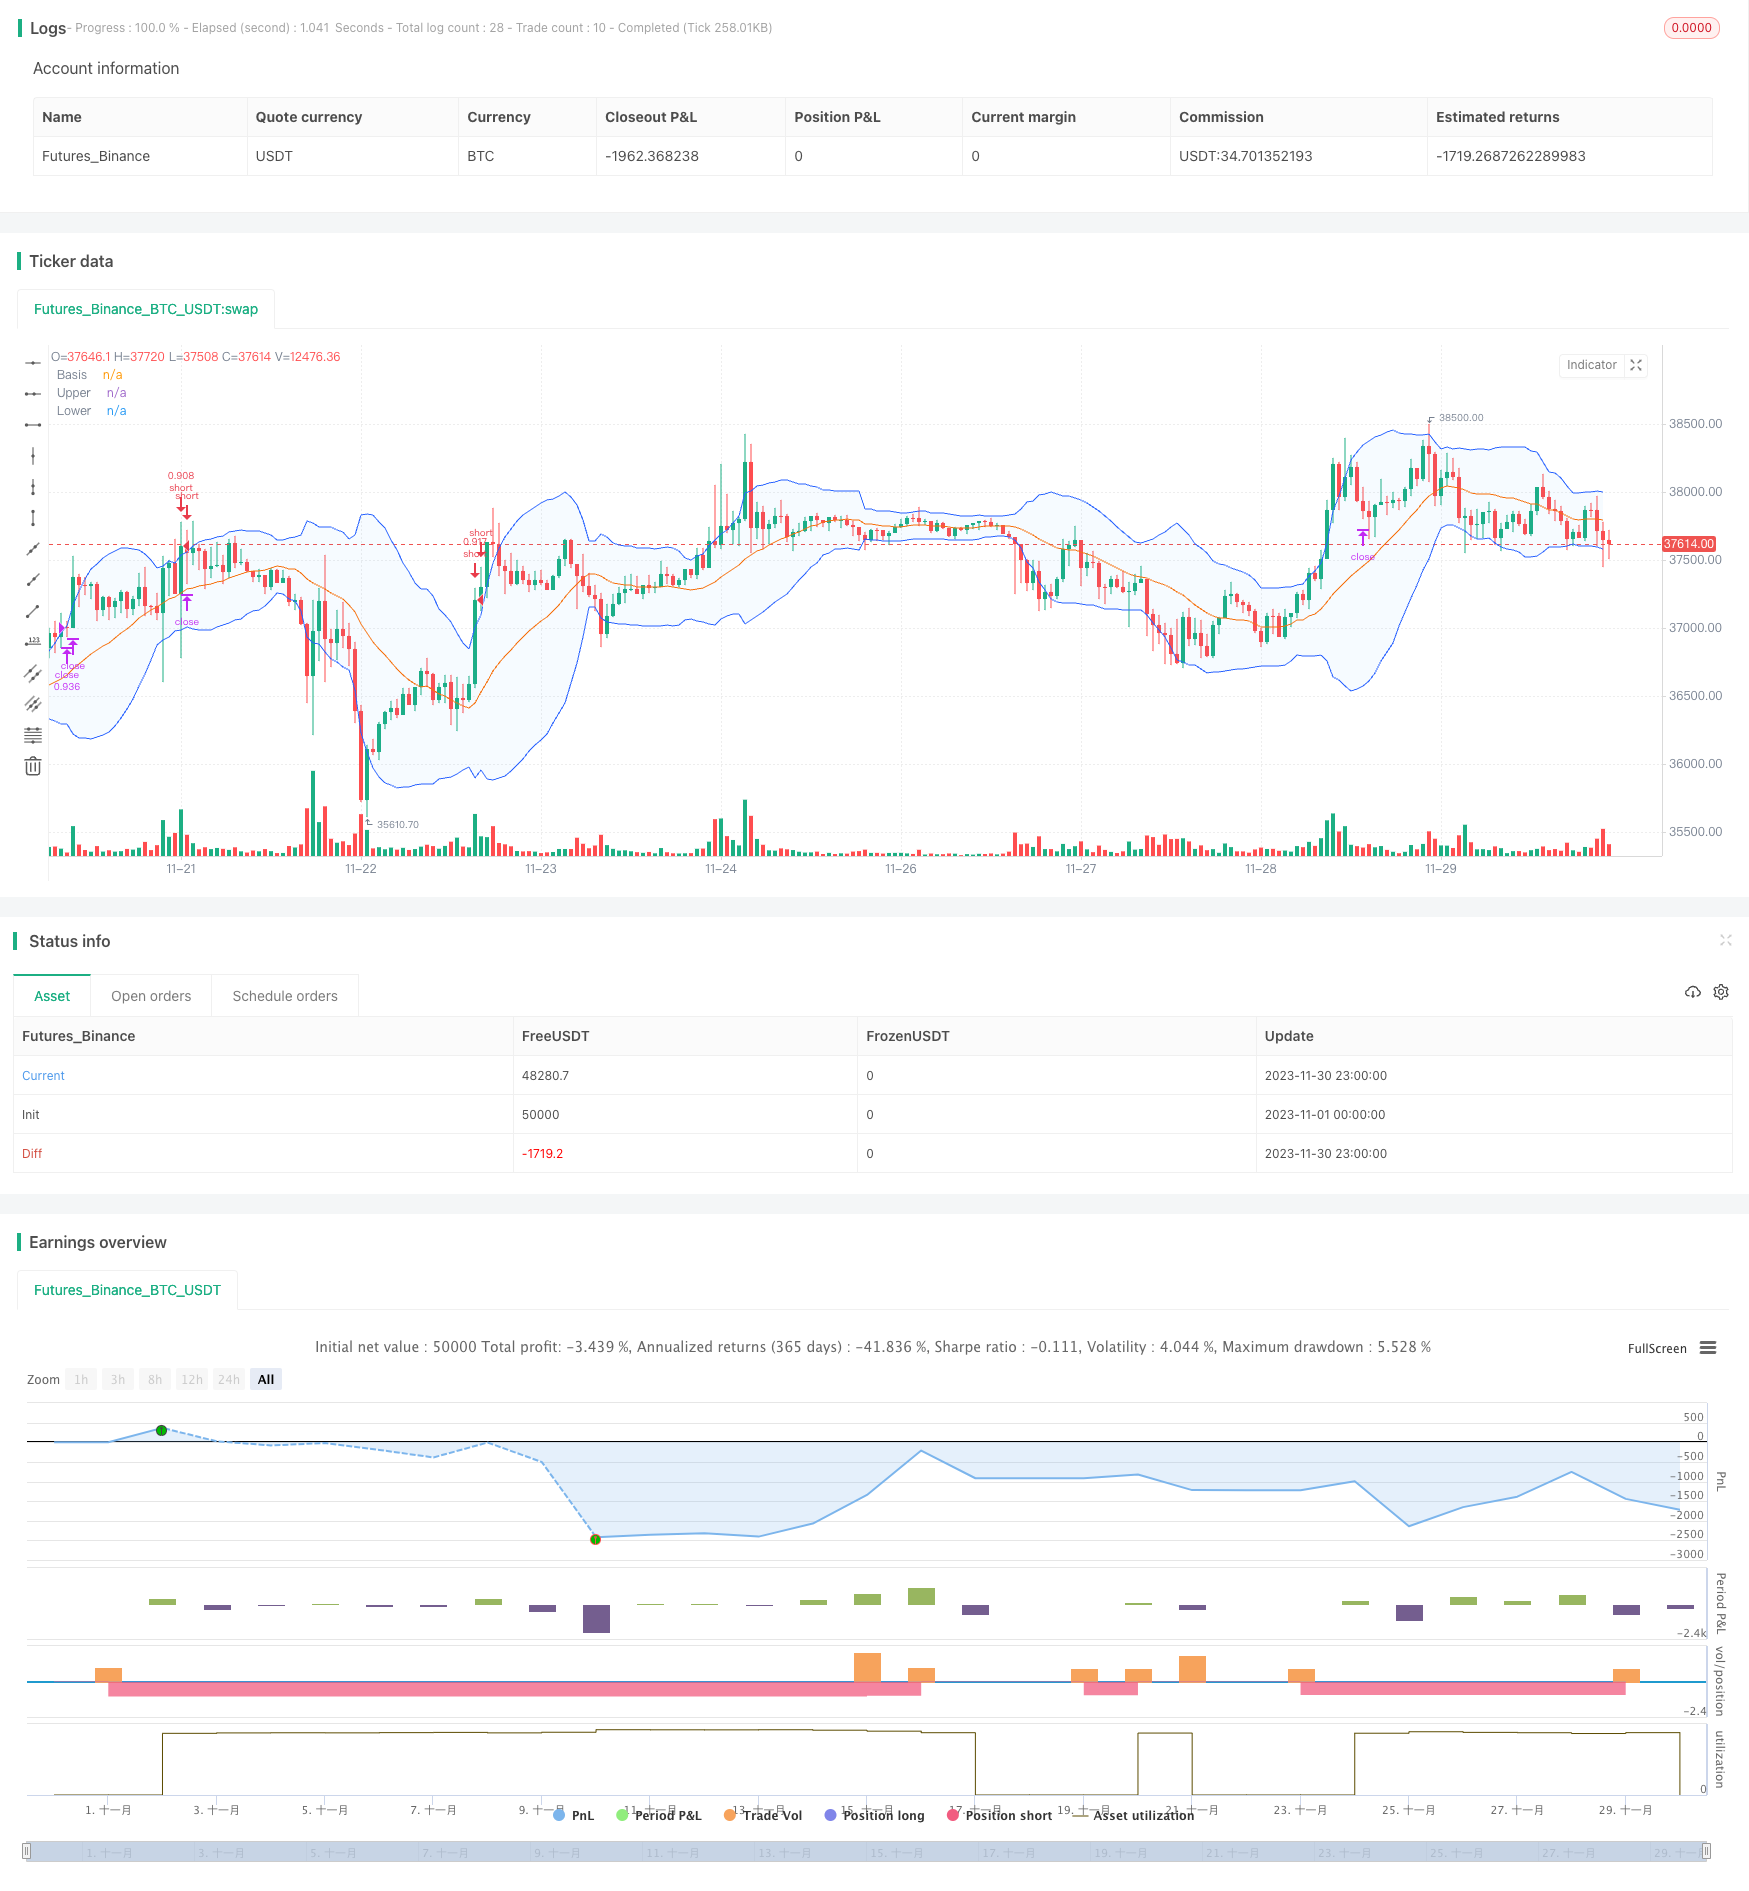
start: 2023-11-01 00:00:00
end: 2023-11-30 23:59:59
period: 1h
basePeriod: 15m
exchanges: [{"eid":"Futures_Binance","currency":"BTC_USDT"}]
*/
//@version=5
// This source code is subject to the terms of the Mozilla Public License 2.0 at https://mozilla.org/MPL/2.0/
// © Coinrule
strategy("Bollinger Band Below Price with RSI",
overlay=true,
initial_capital=1000,
process_orders_on_close=true,
default_qty_type=strategy.percent_of_equity,
default_qty_value=70,
commission_type=strategy.commission.percent,
commission_value=0.1)
showDate = input(defval=true, title='Show Date Range')
timePeriod = time >= timestamp(syminfo.timezone, 2022, 1, 1, 0, 0)
notInTrade = strategy.position_size <= 0
//Bollinger Bands Indicator
length = input.int(20, minval=1)
src = input(close, title="Source")
mult = input.float(2.0, minval=0.001, maxval=50, title="StdDev")
basis = ta.sma(src, length)
dev = mult * ta.stdev(src, length)
upper = basis + dev
lower = basis - dev
offset = input.int(0, "Offset", minval = -500, maxval = 500)
plot(basis, "Basis", color=#FF6D00, offset = offset)
p1 = plot(upper, "Upper", color=#2962FF, offset = offset)
p2 = plot(lower, "Lower", color=#2962FF, offset = offset)
fill(p1, p2, title = "Background", color=color.rgb(33, 150, 243, 95))
// RSI inputs and calculations
lengthRSI = 14
RSI = ta.rsi(close, lengthRSI)
// Configure trail stop level with input options
longTrailPerc = input.float(title='Trail Long Loss (%)', minval=0.0, step=0.1, defval=3) * 0.01
shortTrailPerc = input.float(title='Trail Short Loss (%)', minval=0.0, step=0.1, defval=3) * 0.01
// Determine trail stop loss prices
//longStopPrice = 0.0
shortStopPrice = 0.0
//longStopPrice := if strategy.position_size > 0
//stopValue = close * (1 - longTrailPerc)
//math.max(stopValue, longStopPrice[1])
//else
//0
shortStopPrice := if strategy.position_size < 0
stopValue = close * (1 + shortTrailPerc)
math.min(stopValue, shortStopPrice[1])
else
999999
//Entry and Exit
strategy.entry(id="short", direction=strategy.short, when=ta.crossover(close, upper) and RSI < 70 and timePeriod and notInTrade)
if (ta.crossover(upper, close) and RSI > 70 and timePeriod)
strategy.exit(id='close', limit = shortStopPrice)