RSI指標に基づくクロスタイムフレーム戦略


作成日: 2023-12-29 14:12:54 最終変更日: 2023-12-29 14:12:54
コピー: 0 クリック数: 647
1
フォロー
1623
フォロワー

RSI指標に基づくクロスタイムフレーム戦略

概要

この策略は,RSI指標に基づくクロスタイムフレームのBTC空白策である.この策略は,各K線の交割量加重平均価格 ((VWAP) を計算することでVWAP曲線を得て,その曲線にRSI指標を適用する.RSI指標が超買区から下方へ横断するデッドフォーク信号を表示するときにBTC空白する.

戦略原則

  1. 取引量加重平均値 ((VWAP) を計算して,VWAP曲線が得られる.
  2. VWAP曲線にRSI指標を適用し,パラメータは20日,超買線は85日,超売り線は30日
  3. RSIが超買区 (85),超売区 (30) から下方へ突破すると,空白を入れます.
  4. 28K線を保持した後,RSIが再び超売り線を突破した場合,平仓

優位分析

  1. VWAPを使用すると,単なる閉店価格ではなく,実際の取引価格が反映されます.
  2. RSI指数で超買いと超売りを認識し,高値と低値を追うのを避ける
  3. タイムフレームを横断して操作する
  4. リスクは管理可能で,28K線は停止

リスクと解決策

  1. 緊急事態により,価格が急激に上昇し,損失は抑えられませんでした.
    • タイム・フレームを活用し,被曝のリスクを低減する
  2. パラメータが正しく設定されず,機会が逃れやすい
    • RSIパラメータと超買超売ラインのテストと最適化
  3. K線が超市街に突入できない
    • 他の指標の判断傾向と組み合わせたパラメータの柔軟な調整

最適化の方向

  1. 複数のパラメータをテストし,最適なパラメータを見つけます.
  2. MACD,KDなどの他の指標と組み合わせて,超買超売領域に入っているかどうかを判断します.
  3. 種別テストパラメータの設定
  4. ストップ・メカニズムの最適化,変動率によるストップ・幅度設定

要約する

この戦略はVWAPとRSIを組み合わせてBTCの超買超売状態を識別し,タイムフレームを越えた方法で操作し,リスクを効果的に制御することができる.戦略の考え方は明確で分かりやすいであり,さらなるテストと最適化の価値があり,实体取引に適用される.

ストラテジーソースコード
/*backtest
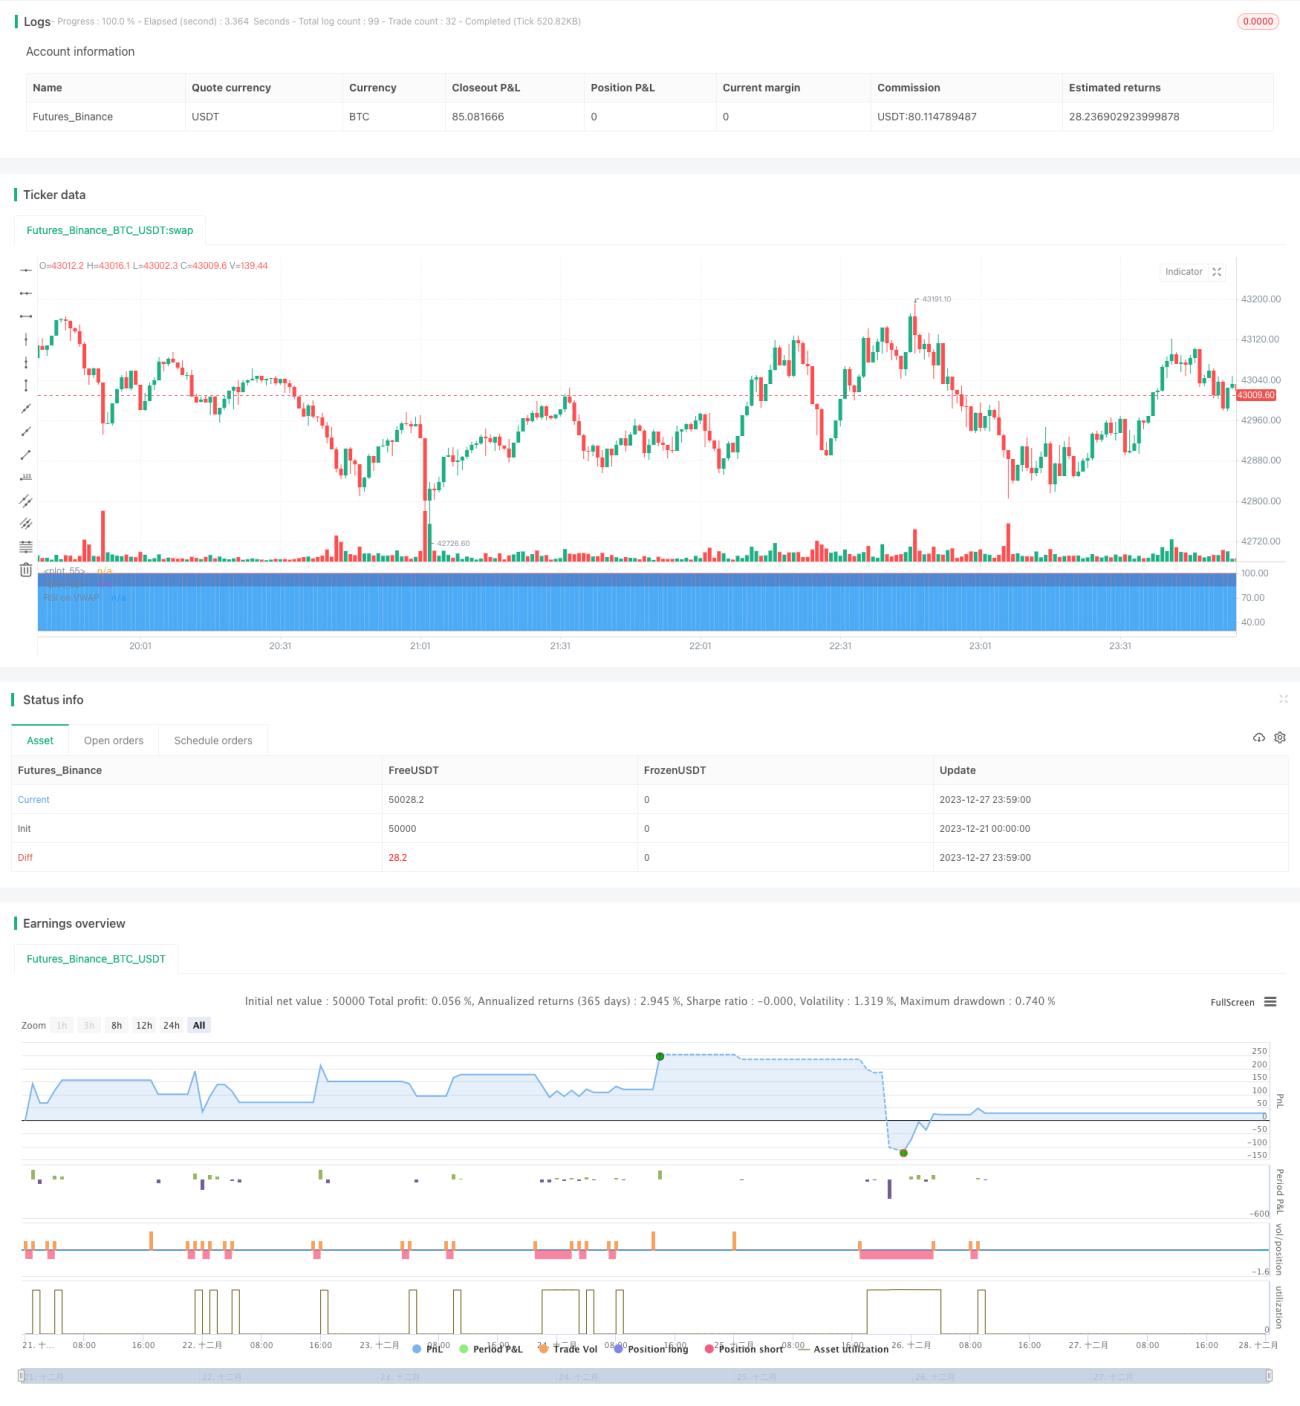
start: 2023-12-21 00:00:00
end: 2023-12-28 00:00:00
period: 1m
basePeriod: 1m
exchanges: [{"eid":"Futures_Binance","currency":"BTC_USDT"}]
*/


//@version=4

strategy("Soran Strategy 2 - SHORT SIGNALS", pyramiding=1, initial_capital=1000, default_qty_type=strategy.percent_of_equity, default_qty_value=50, overlay=false)


// ----------------- Inputs ----------------- //

reso = input(title="Resolution", type=input.resolution, defval="")
length = input(20, title="RSI Length", type=input.integer)
ovrsld = input(30, "RSI Oversold level", type=input.float)
ovrbgt = input(85, "RSI Overbought level", type=input.float)
lateleave = input(28, "Number of candles", type=input.integer)
// lateleave : numbers of bars in overbought/oversold zones where the position is closed. The position is closed when this number is reached or when the zone is left (the first condition).

// best parameters BTCUSDTPERP M15 : 20 / 30 / 85 / 28


stratbull = input(title="Enter longs ?", type = input.bool, defval=true)
stratbear = input(title="Enter shorts ?", type = input.bool, defval=true)

stratyear = input(2020, title = "Strategy Start Year")
stratmonth = input(1, title = "Strategy Start Month")
stratday = input(1, title = "Strategy Start Day")
stratstart = timestamp(stratyear,stratmonth,stratday,0,0)


// --------------- Laguerre ----------------- //

laguerre = input(title="Use Laguerre on RSI ?", type=input.bool, defval=false)
gamma = input(0.06, title="Laguerre Gamma")

laguerre_cal(s,g) =>
    l0 = 0.0
    l1 = 0.0
    l2 = 0.0
    l3 = 0.0
    l0 := (1 - g)*s+g*nz(l0[1])
    l1 := -g*l0+nz(l0[1])+g*nz(l1[1])
    l2 := -g*l1+nz(l1[1])+g*nz(l2[1])
    l3 := -g*l2+nz(l2[1])+g*nz(l3[1])
    (l0 + 2*l1 + 2*l2 + l3)/6


// ---------------- Rsi VWAP ---------------- //

rsiV = security(syminfo.tickerid, reso, rsi(vwap(close), length))

rsiVWAP = laguerre ? laguerre_cal(rsiV,gamma) : rsiV


// ------------------ Plots ----------------- //

prsi = plot(rsiVWAP, color = rsiVWAP>ovrbgt ? color.red : rsiVWAP<ovrsld ? color.green : color.white, title="RSI on VWAP", linewidth=1, style=plot.style_line)
hline = plot(ovrbgt, color = color.gray, style=plot.style_line)
lline = plot(ovrsld, color = color.gray, style=plot.style_line)
fill(prsi,hline, color = rsiVWAP > ovrbgt ? color.red : na, transp = 30)
fill(prsi,lline, color = rsiVWAP < ovrsld ? color.green : na, transp = 30)


// ---------------- Positions: only shows the Short and close shoret positions --------------- //

timebull = stratbull and time > stratstart
timebear = stratbear and time > stratstart


strategy.entry("Short", false, when = timebear and crossunder(rsiVWAP, ovrbgt), comment="")
strategy.close("Short", when = timebear and crossunder(rsiVWAP, ovrsld)[lateleave] or crossover(rsiVWAP, ovrsld), comment="")