複数の指標に基づく暗号通貨の高値と安値戦略
概要
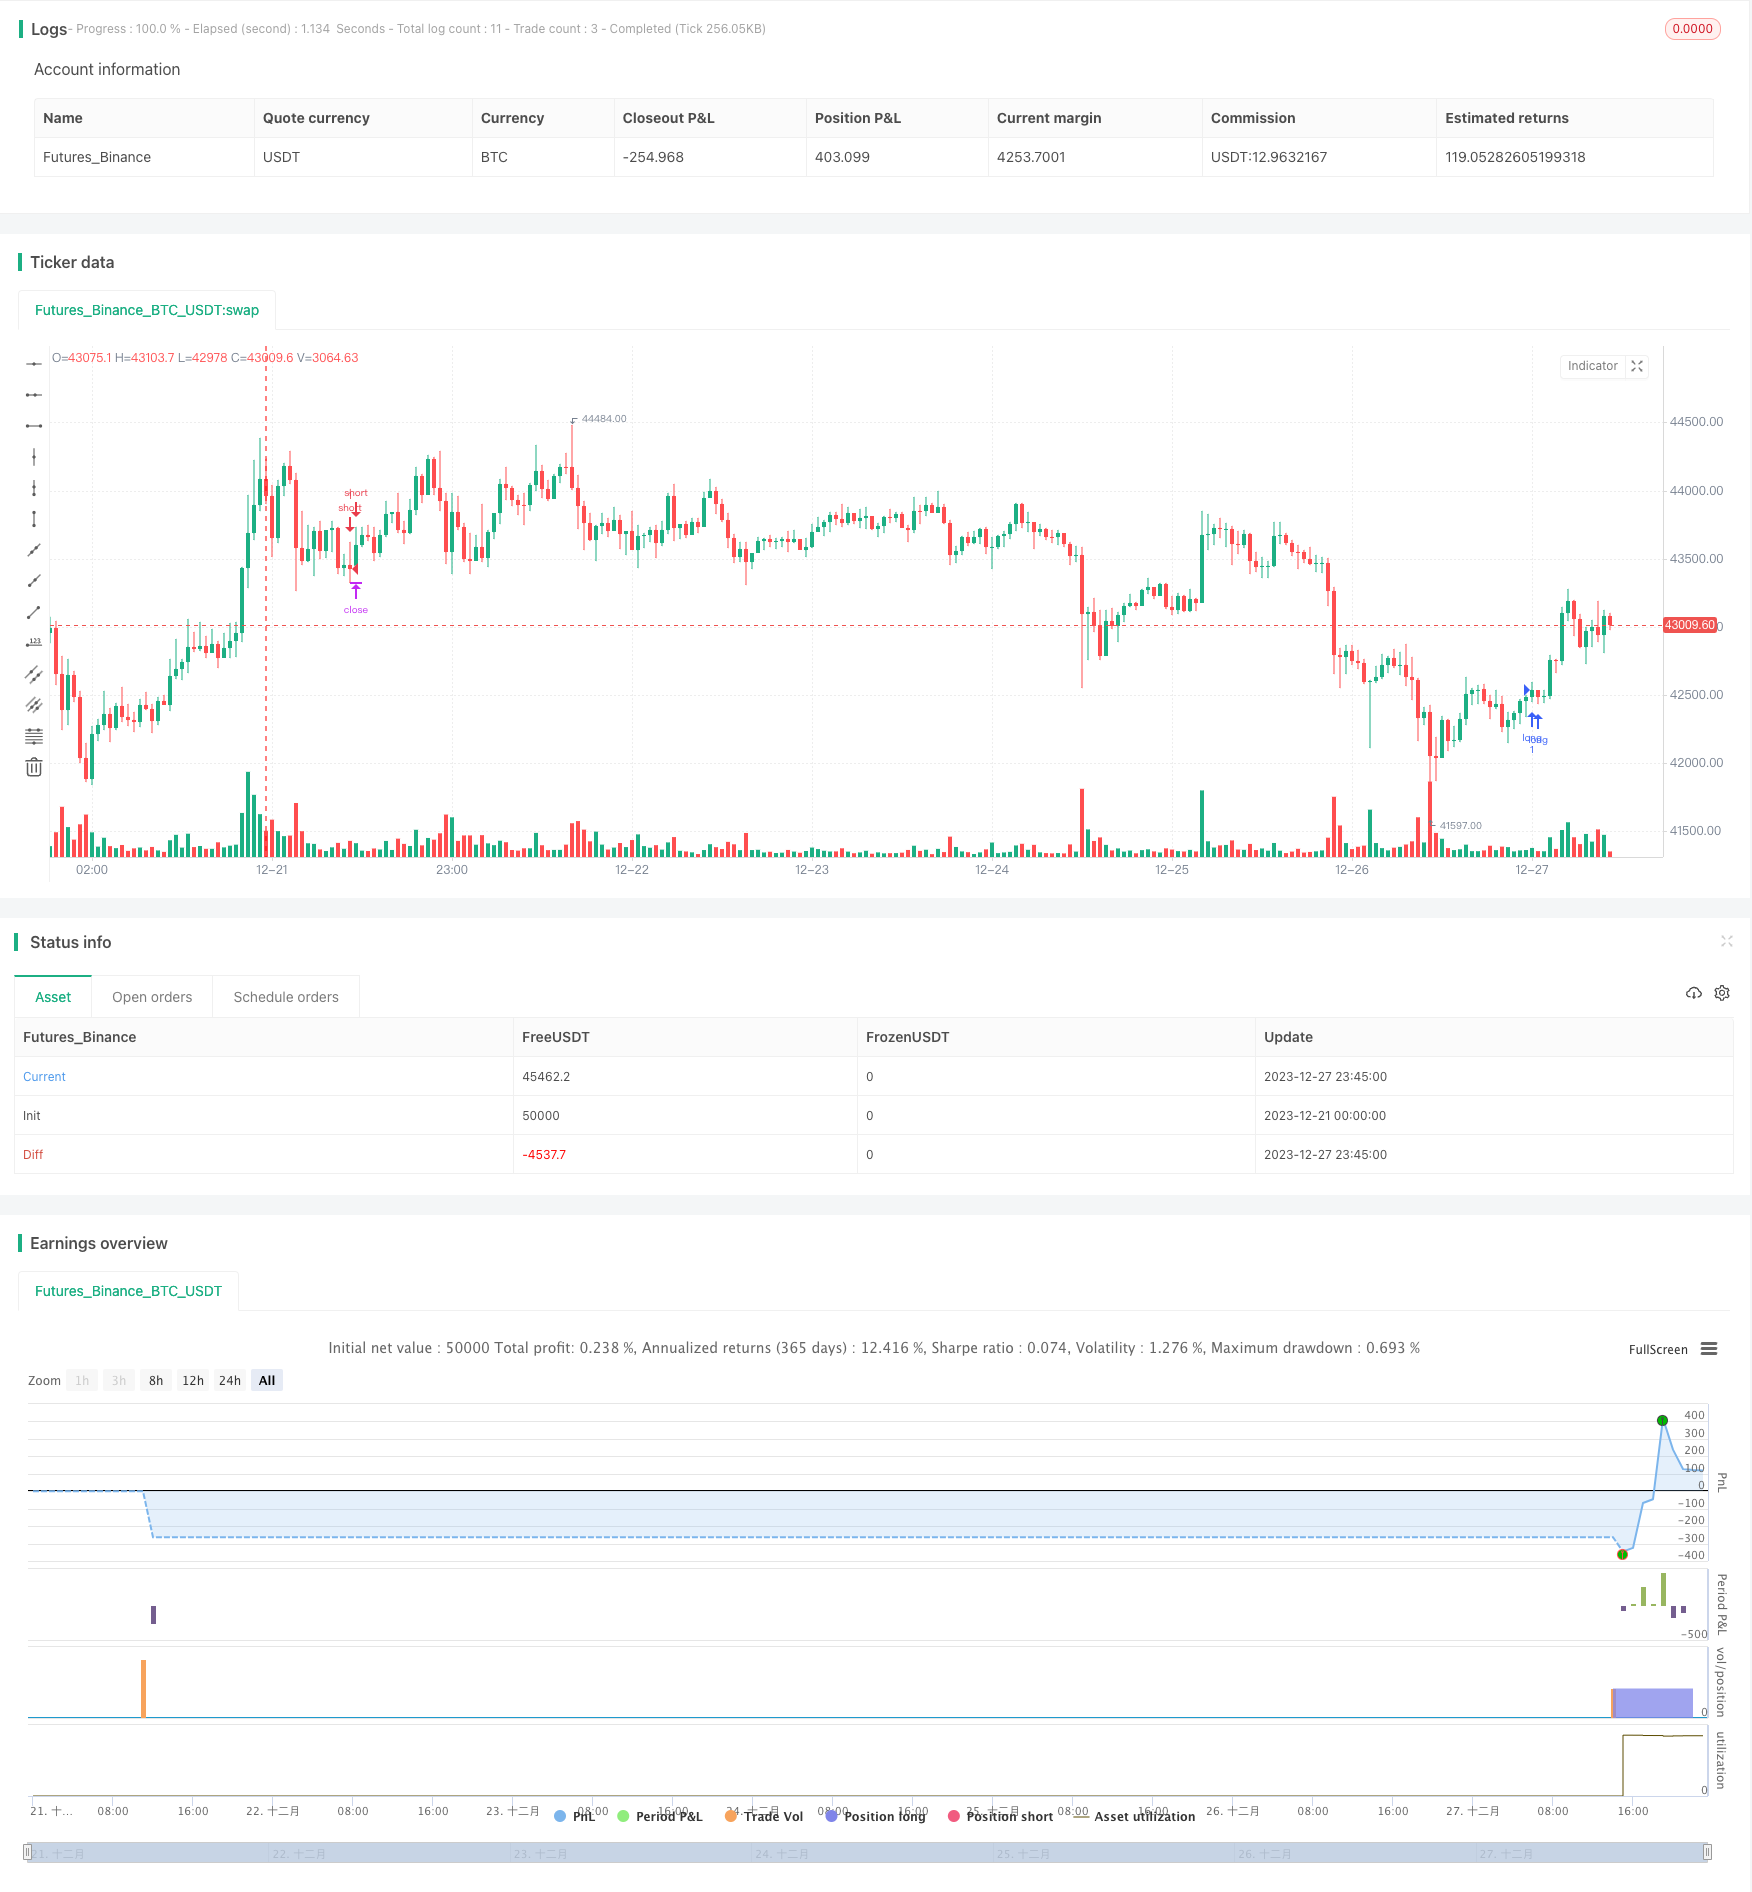
この戦略は,暗号通貨市場に適した高低位戦略である.これは,MACD,PSAR,ATR,エリオット波などの複数の指標を総合的に使用し,1時間,4時間または1日などの高時間の周期で取引する.この戦略の利点は,リスクが高く,平均利益因子が1.5-2.5に達するものである.
戦略原則
この戦略の取引シグナルは,価格の高低点と複数の指標の総合的な判断から来る.具体的論理は:
価格の高低の区間があるかどうかを判断する.つまり,高点では連続的な革新が高く,低点では連続的な革新が低い.
MACDの直角図のレベルをチェックする.
PSARの指標をチェックしてトレンドの方向を判断する.
ATRとMAで作成したトレンド指標をチェックしてトレンドの方向を判断する.
エリオット波の指数は,トレンドの方向を確認します.
上記の5つの条件が同じ方向を指している場合,多行または空行信号が生じる.
戦略的優位性
リスク・リターン・レート (RRR) は1:30.
平均収益因子は高で,一般的には1.5-2.5の範囲である.
複数の指標の組み合わせにより,偽突破を効果的にフィルターできます.
戦略リスク
投票率は10~20%しかありません.
引き下がりと引き下げのリスクがある.
市場環境によって影響を受けます.
心理的に強い抵抗力が必要です.
対策として
取引資金の規模を拡大し,勝率を均衡させる.
単発損失を厳格に管理する.
市場によって指標のパラメータを調整する.
ポジションの規模を把握する
最適化の方向
異なる暗号通貨と市場環境のテスト指標のパラメータに応じて.
資金管理の最適化のためのストップ・ローズ・ストップ・ストップ・ストラテジーを追加する
機械学習の組み合わせにより 勝利率の向上
ソーシャル・エモーション・インディケーターのフィルタリングが,取引の信号を増やします.
複数の時間周期の指標確認を考慮する.
要約する
この戦略は,全体として,暗号通貨に適した高リスク高収益取引戦略である.この戦略の優点は,リスクのリターン率が高く,平均利益因子が高く得ることができるという点にある.リスクは,主に,勝利率が低く,強い心理的耐性が必要であるという点にある.次の最適化の方向は,パラメータの調整,資金管理の最適化,勝利率の向上など,複数の次元から行える.全体として,この戦略は,高収益を求める暗号通貨トレーダーにとって,実用的な価値がある.
/*backtest
start: 2023-12-21 00:00:00
end: 2023-12-28 00:00:00
period: 45m
basePeriod: 5m
exchanges: [{"eid":"Futures_Binance","currency":"BTC_USDT"}]
*/

// This source code is subject to the terms of the Mozilla Public License 2.0 at https://mozilla.org/MPL/2.0/
// © SoftKill21

//@version=4
strategy("Crypto strategy high/low", overlay=true)
fast_length = input(title="Fast Length", type=input.integer, defval=12)
slow_length = input(title="Slow Length", type=input.integer, defval=26)
src = input(title="Source", type=input.source, defval=close)
signal_length = input(title="Signal Smoothing", type=input.integer, minval = 1, maxval = 50, defval = 9)
sma_source = input(title="Simple MA(Oscillator)", type=input.bool, defval=true)
sma_signal = input(title="Simple MA(Signal Line)", type=input.bool, defval=false)
//sar
start = input(0.02)
increment = input(0.02)
maximum = input(0.2)
var bool uptrend = na
var float EP = na
var float SAR = na
var float AF = start
var float nextBarSAR = na
if bar_index > 0
	firstTrendBar = false
	SAR := nextBarSAR
	if bar_index == 1
		float prevSAR = na
		float prevEP = na
		lowPrev = low[1]
		highPrev = high[1]
		closeCur = close
		closePrev = close[1]
		if closeCur > closePrev
			uptrend := true
			EP := high
			prevSAR := lowPrev
			prevEP := high
		else
			uptrend := false
			EP := low
			prevSAR := highPrev
			prevEP := low
		firstTrendBar := true
		SAR := prevSAR + start * (prevEP - prevSAR)
	if uptrend
		if SAR > low
			firstTrendBar := true
			uptrend := false
			SAR := max(EP, high)
			EP := low
			AF := start
	else
		if SAR < high
			firstTrendBar := true
			uptrend := true
			SAR := min(EP, low)
			EP := high
			AF := start
	if not firstTrendBar
		if uptrend
			if high > EP
				EP := high
				AF := min(AF + increment, maximum)
		else
			if low < EP
				EP := low
				AF := min(AF + increment, maximum)
	if uptrend
		SAR := min(SAR, low[1])
		if bar_index > 1
			SAR := min(SAR, low[2])
	else
		SAR := max(SAR, high[1])
		if bar_index > 1
			SAR := max(SAR, high[2])
	nextBarSAR := SAR + AF * (EP - SAR)


// Calculating
fast_ma = sma_source ? sma(src, fast_length) : ema(src, fast_length)
slow_ma = sma_source ? sma(src, slow_length) : ema(src, slow_length)
macd = fast_ma - slow_ma
signal = sma_signal ? sma(macd, signal_length) : ema(macd, signal_length)
hist = macd - signal

CCI = input(20)
ATR = input(5)
Multiplier=input(1,title='ATR Multiplier')
original=input(true,title='original coloring')
thisCCI = cci(close, CCI)
lastCCI = nz(thisCCI[1])
bufferDn= high + Multiplier * sma(tr,ATR)
bufferUp= low - Multiplier * sma(tr,ATR)
if (thisCCI >= 0 and lastCCI < 0)
    bufferUp := bufferDn[1]
if (thisCCI <= 0 and lastCCI > 0)
    bufferDn := bufferUp[1]

if (thisCCI >= 0)
    if (bufferUp < bufferUp[1])
        bufferUp := bufferUp[1]
else
    if (thisCCI <= 0)
        if (bufferDn > bufferDn[1])
            bufferDn := bufferDn[1]
x=0.0
x:=thisCCI >= 0 ?bufferUp:thisCCI <= 0 ?bufferDn:x[1]
swap=0.0

swap:=x>x[1]?1:x<x[1]?-1:swap[1]

swap2=swap==1?color.lime:color.red
swap3=thisCCI >=0 ?color.lime:color.red
swap4=original?swap3:swap2

//elliot wave
srce = input(close, title="source")
sma1length = input(5)
sma2length = input(35)
UsePercent = input(title="Show Dif as percent of current Candle", type=input.bool, defval=true)
smadif=iff(UsePercent,(sma(srce, sma1length) - sma(srce, sma2length)) / srce * 100, sma(srce, sma1length) - sma(srce, sma2length))
col=smadif <= 0 ? color.red : color.green

longC = high > high[1] and high[1] > high[2] and close[2] > high[3] and hist > 0 and uptrend and smadif < 0 and swap4==color.lime
//longC = high > high[1] and high[1] > high[2] and high[2] > high[3] and high[3] > high[4] and close[4] > high[5]
shortC = low < low[1] and low[1] < low[2] and close[2] < low[3] and hist < 0 and not uptrend and  smadif > 0 and swap4==color.red
//shortC = low < low[1] and low[1] < low[2] and low[2] < low[3] and low[3] < low[4] and close[4] < low[5]

tp=input(0.15, title="tp")
sl=input(0.005, title="sl")


strategy.entry("long",1,when=longC)
strategy.entry("short",0,when=shortC)

strategy.exit("x_long", "long" ,loss = close * sl / syminfo.mintick, profit = close * tp / syminfo.mintick , alert_message = "closelong")
//strategy.entry("short",0, when= loss = close * sl / syminfo.mintick)

strategy.exit("x_short", "short" , loss = close * sl / syminfo.mintick, profit  = close * tp / syminfo.mintick,alert_message = "closeshort")
//strategy.entry("long",1, when = loss = close * sl / syminfo.mintick)

//strategy.close("long",when= hist < 0)
//strategy.close("short", when= hist > 0)