指数移動平均とトレーリングストップロスおよびパーセンテージストップロスを組み合わせた株式定量取引戦略
概要
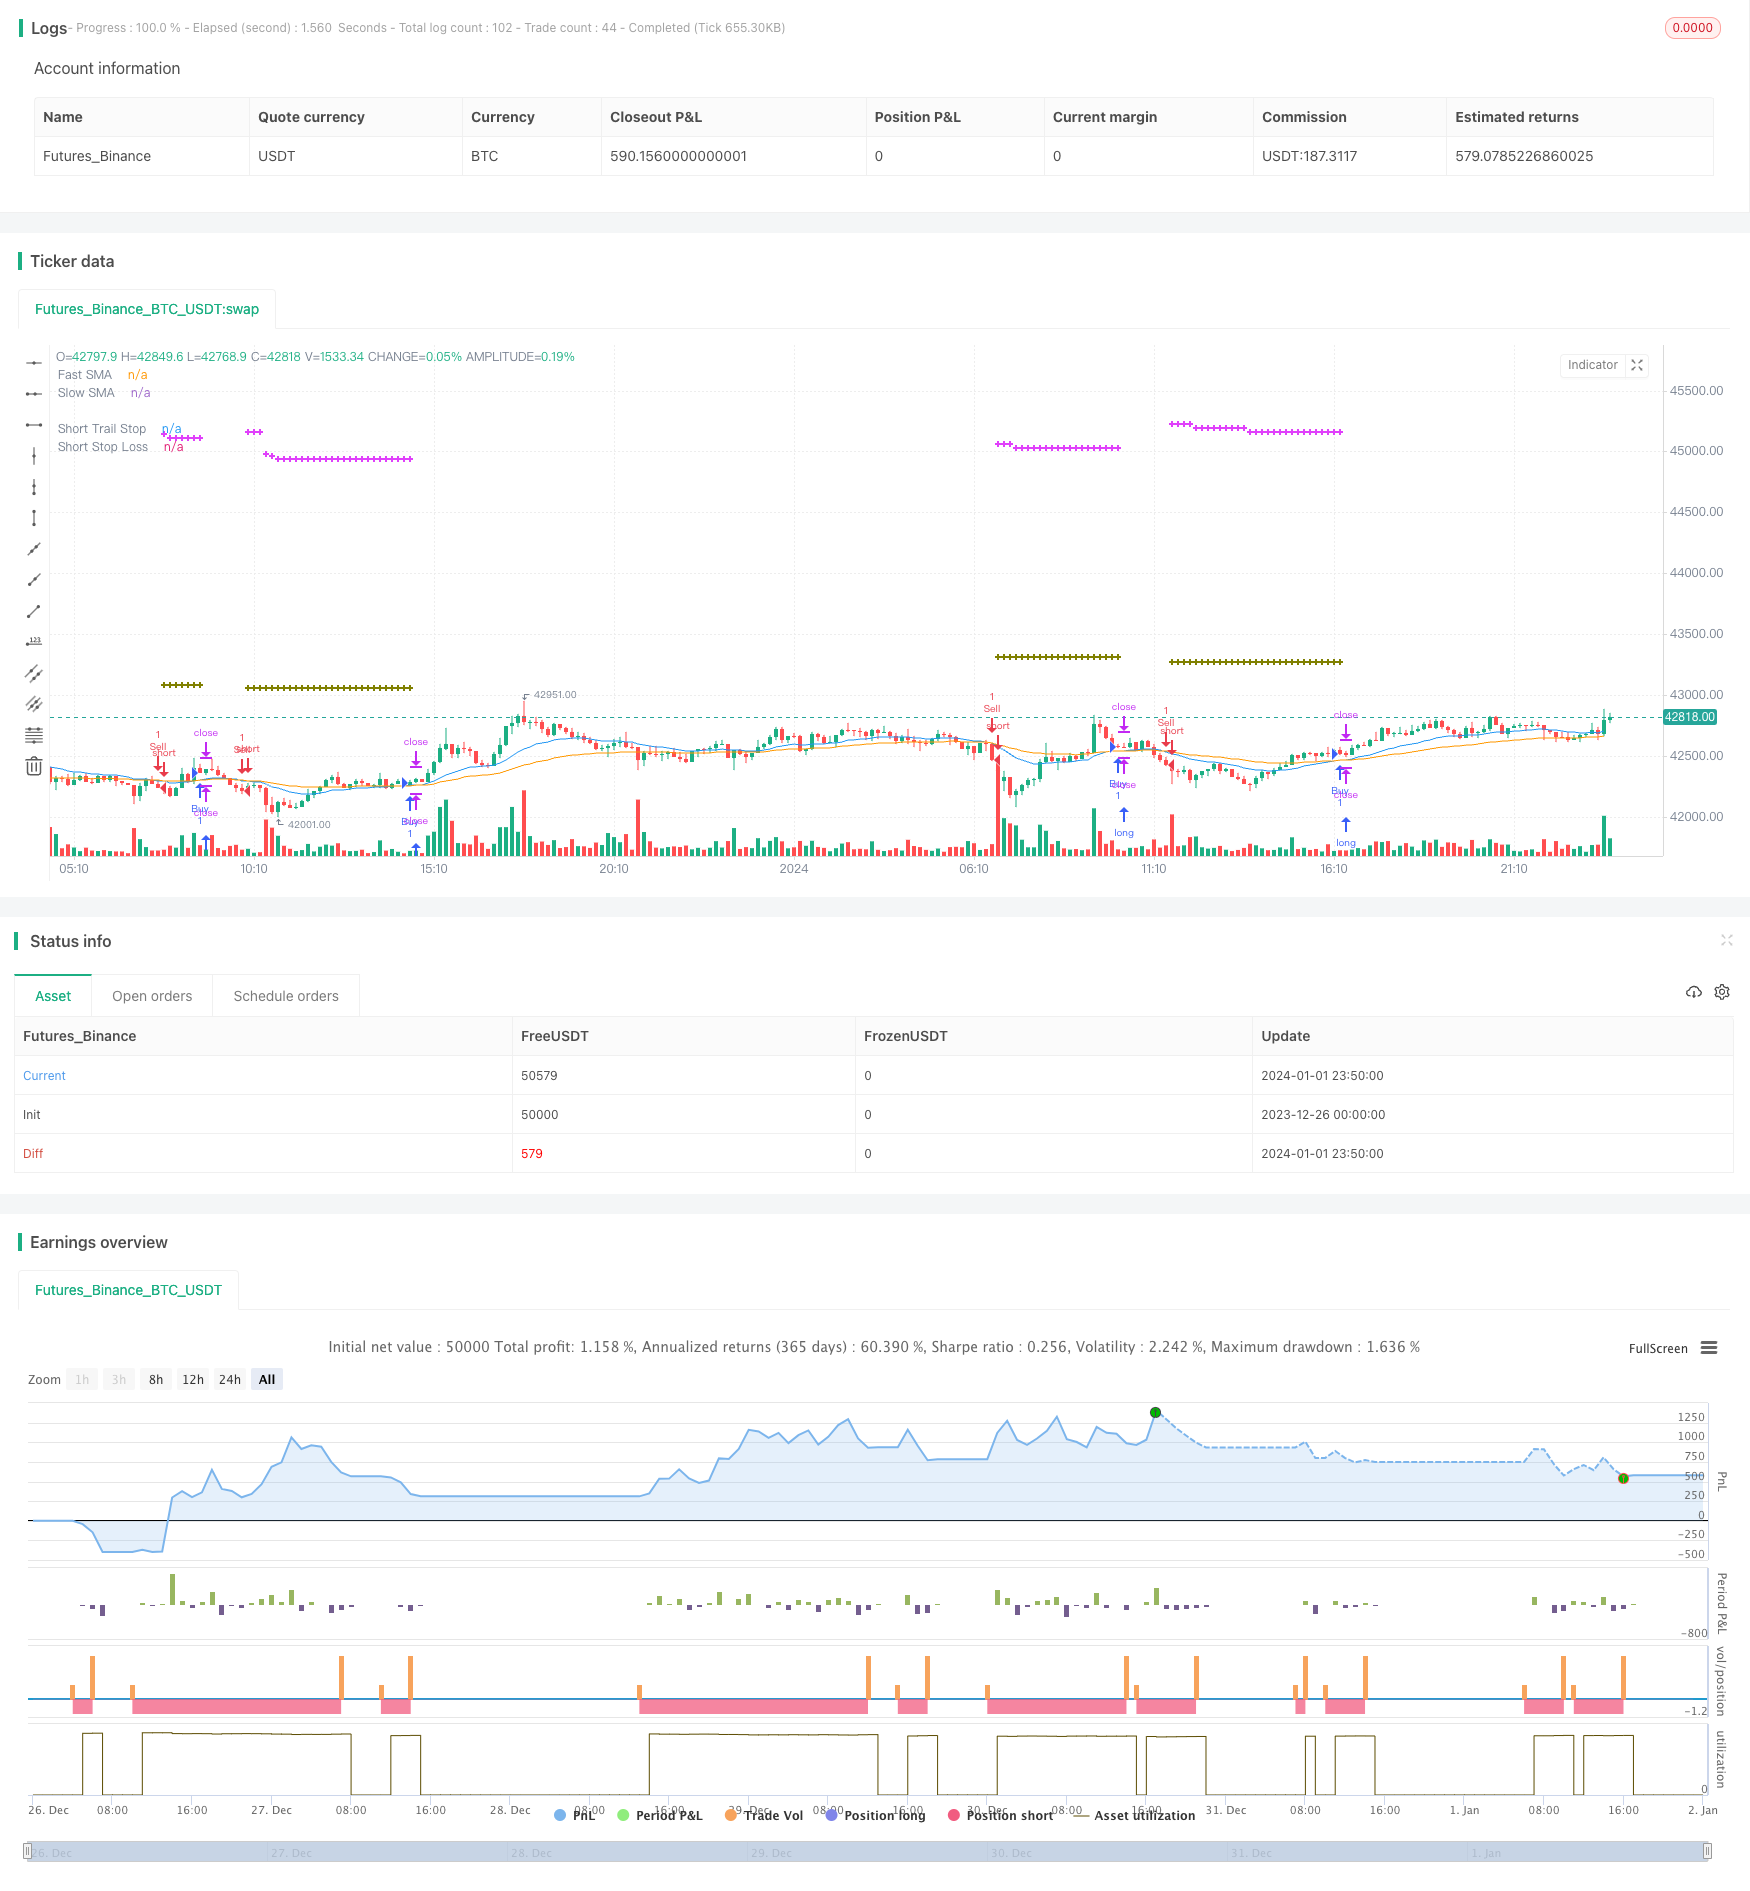
この戦略の核心は,インデックス平滑移動平均を買入シグナルとして使用し,尾行ストップとパーセンテージストップを組み合わせて利益をロックし,リスクを制御する.戦略は,簡単に実行でき,株式や他の金融製品の量的な取引に適用されます.
戦略原則
急速EMAと遅いEMAを計算する.急速EMAの周期は20日,遅いEMAの周期は50日である. 急速EMAの上を通過すると買い信号が生成され,急速EMA下を通過すると売り信号が生成される.
入場後に尾行ストップを設定し,多ポジションの尾行ストップと空ポジションの尾行ストップの割合をそれぞれ,例えば7%で設定する.尾行ストップは,K線ごとに自動的に調整され,最大限の利益をロックする.
同時にストップ・ロスの位置を設定し,ポジションの方向と入場価格に応じて,多ポジションのストップ・ロスの価格と空ポジションのストップ・ロスの価格の割合をそれぞれ設定する.例えば2%.ストップ・ロスの位置は固定され,過大損失を防止する.
ストップ・コストとストップ・コストを比較し,市場価格に近いストップ・ポジションを選択し,本取引のためのストップ・コストを発行する.
戦略的優位性
移動平均のシグナルは理解しやすく,実行しやすい.
追跡・ストップ・ロスは,利益を最大限に固定し,誤判による不必要な損失を防止します.
取引の最大損失をコントロールできる.
追随ストップと固定ストップを組み合わせて,利潤をロックし,リスクを制御します.
リスクと対策
移動平均策は偽信号を生じやすく,urther 強いフィルタリング条件を導入する.
尾行止損は時として早めに止損し,適正に止損幅を緩めることもある.
固定ストップポジションの設定が不適切である場合,過度に過激または保守的であり,テストでパーセントパラメータを調整する必要があります.
機械的にストップすることは,市場の逆転の機会を逃す可能性があり,技術指標と組み合わせてストップ判断することができる.
思考を最適化する
異なるパラメータのEMAの組み合わせを試して,最適なバランスを探す.
偽信号をフィルタリングする指標として,取引量なども加わっています.
株のテストにより,適切なストップ・ロスのパラメータを見つけます.
モバイル・ストップを追加し,市場に応じてストップポジションを調整する.
RSIなどの指標を組み合わせて止損時間を判断する.
要約する
この戦略は,移動平均取引シグナル,尾行ストップとパーセンテージストップを統合し,パラメータを最適化することで,安定した利益を得ながらもリスクを厳格に制御しながら,複数の株式や商品に適用でき,トレーダーの研究実践を量化して継続的に最適化する価値があります.
/*backtest
start: 2023-12-26 00:00:00
end: 2024-01-02 00:00:00
period: 10m
basePeriod: 1m
exchanges: [{"eid":"Futures_Binance","currency":"BTC_USDT"}]
*/

// This source code is subject to the terms of the Mozilla Public License 2.0 at https://mozilla.org/MPL/2.0/
// © wouterpruym1828

//@version=5
strategy(title=" Combining Trailing Stop and Stop loss (% of instrument price)",
     overlay=true, pyramiding=1, shorttitle="TSL&SL%")

//INDICATOR SECTION

// Indicator Input options+
i_FastEMA = input.int(title = "Fast EMA period", minval = 0, defval = 20)
i_SlowEMA = input.int(title = "Slow EMA period", minval = 0, defval = 50)

// Calculate moving averages
fastEMA = ta.ema(close, i_FastEMA)
slowEMA = ta.ema(close, i_SlowEMA)

// Plot moving averages
plot(fastEMA, title="Fast SMA", color=color.blue)
plot(slowEMA, title="Slow SMA", color=color.orange)


//STRATEGY SECTION

// Calculate trading conditions
buy  = ta.crossover(fastEMA, slowEMA)
sell = ta.crossunder(fastEMA, slowEMA)

// STEP 1:
// Configure trail stop loss level with input options (optional)

longTrailPerc = input.float(title="Long Trailing Stop (%)", minval=0.0, step=0.1, defval=7) * 0.01

shortTrailPerc = input.float(title="Short Trailing Stop (%)", minval=0.0, step=0.1, defval=7) * 0.01

//Configure stop loss level with input options (optional)

longStopPerc = input.float(title="Long Stop Loss (%)", minval=0.0, step=0.1, defval=2)*0.01

shortStopPerc = input.float(title="Short Stop Loss (%)", minval=0.0, step=0.1, defval=2)*0.01


// STEP 2:
// Determine trail stop loss prices
longTrailPrice = 0.0, shortTrailPrice = 0.0

longTrailPrice := if (strategy.position_size > 0)
    stopValue = high * (1 - longTrailPerc)
    math.max(stopValue, longTrailPrice[1])
else
    0

shortTrailPrice := if (strategy.position_size < 0)
    stopValue = low * (1 + shortTrailPerc)
    math.min(stopValue, shortTrailPrice[1])
else
    999999

// Determine stop loss prices
entryPrice = 0.0

entryPrice := strategy.opentrades.entry_price(strategy.opentrades - 1)


longLossPrice = entryPrice * (1 - longStopPerc)

shortLossPrice = entryPrice * (1 + shortStopPerc)


// Plot stop loss values for confirmation

plot(series=(strategy.position_size > 0) ? longTrailPrice : na,
     color=color.fuchsia, style=plot.style_cross,
     linewidth=2, title="Long Trail Stop")
plot(series=(strategy.position_size < 0) ? shortTrailPrice : na,
     color=color.fuchsia, style=plot.style_cross,
     linewidth=2, title="Short Trail Stop")

plot(series=(strategy.position_size > 0) ? longLossPrice : na,
     color=color.olive, style=plot.style_cross,
     linewidth=2, title="Long Stop Loss")
plot(series=(strategy.position_size < 0) ? shortLossPrice : na,
     color=color.olive, style=plot.style_cross,
     linewidth=2, title="Short Stop Loss")

// Submit entry orders
if (buy)
    strategy.entry("Buy", strategy.long)

if (sell)
    strategy.entry("Sell", strategy.short)


//Evaluating trailing stop or stop loss to use

longStopPrice = longTrailPrice < longLossPrice ? longLossPrice : longTrailPrice

shortStopPrice = shortTrailPrice > shortLossPrice ? shortLossPrice : shortTrailPrice

// STEP 3:
// Submit exit orders for stop price

if (strategy.position_size > 0)
    strategy.exit(id="Buy Stop", stop=longStopPrice)

if (strategy.position_size < 0)
    strategy.exit(id="Sell Stop", stop=shortStopPrice)