モメンタムトレンドフォロー戦略
概要
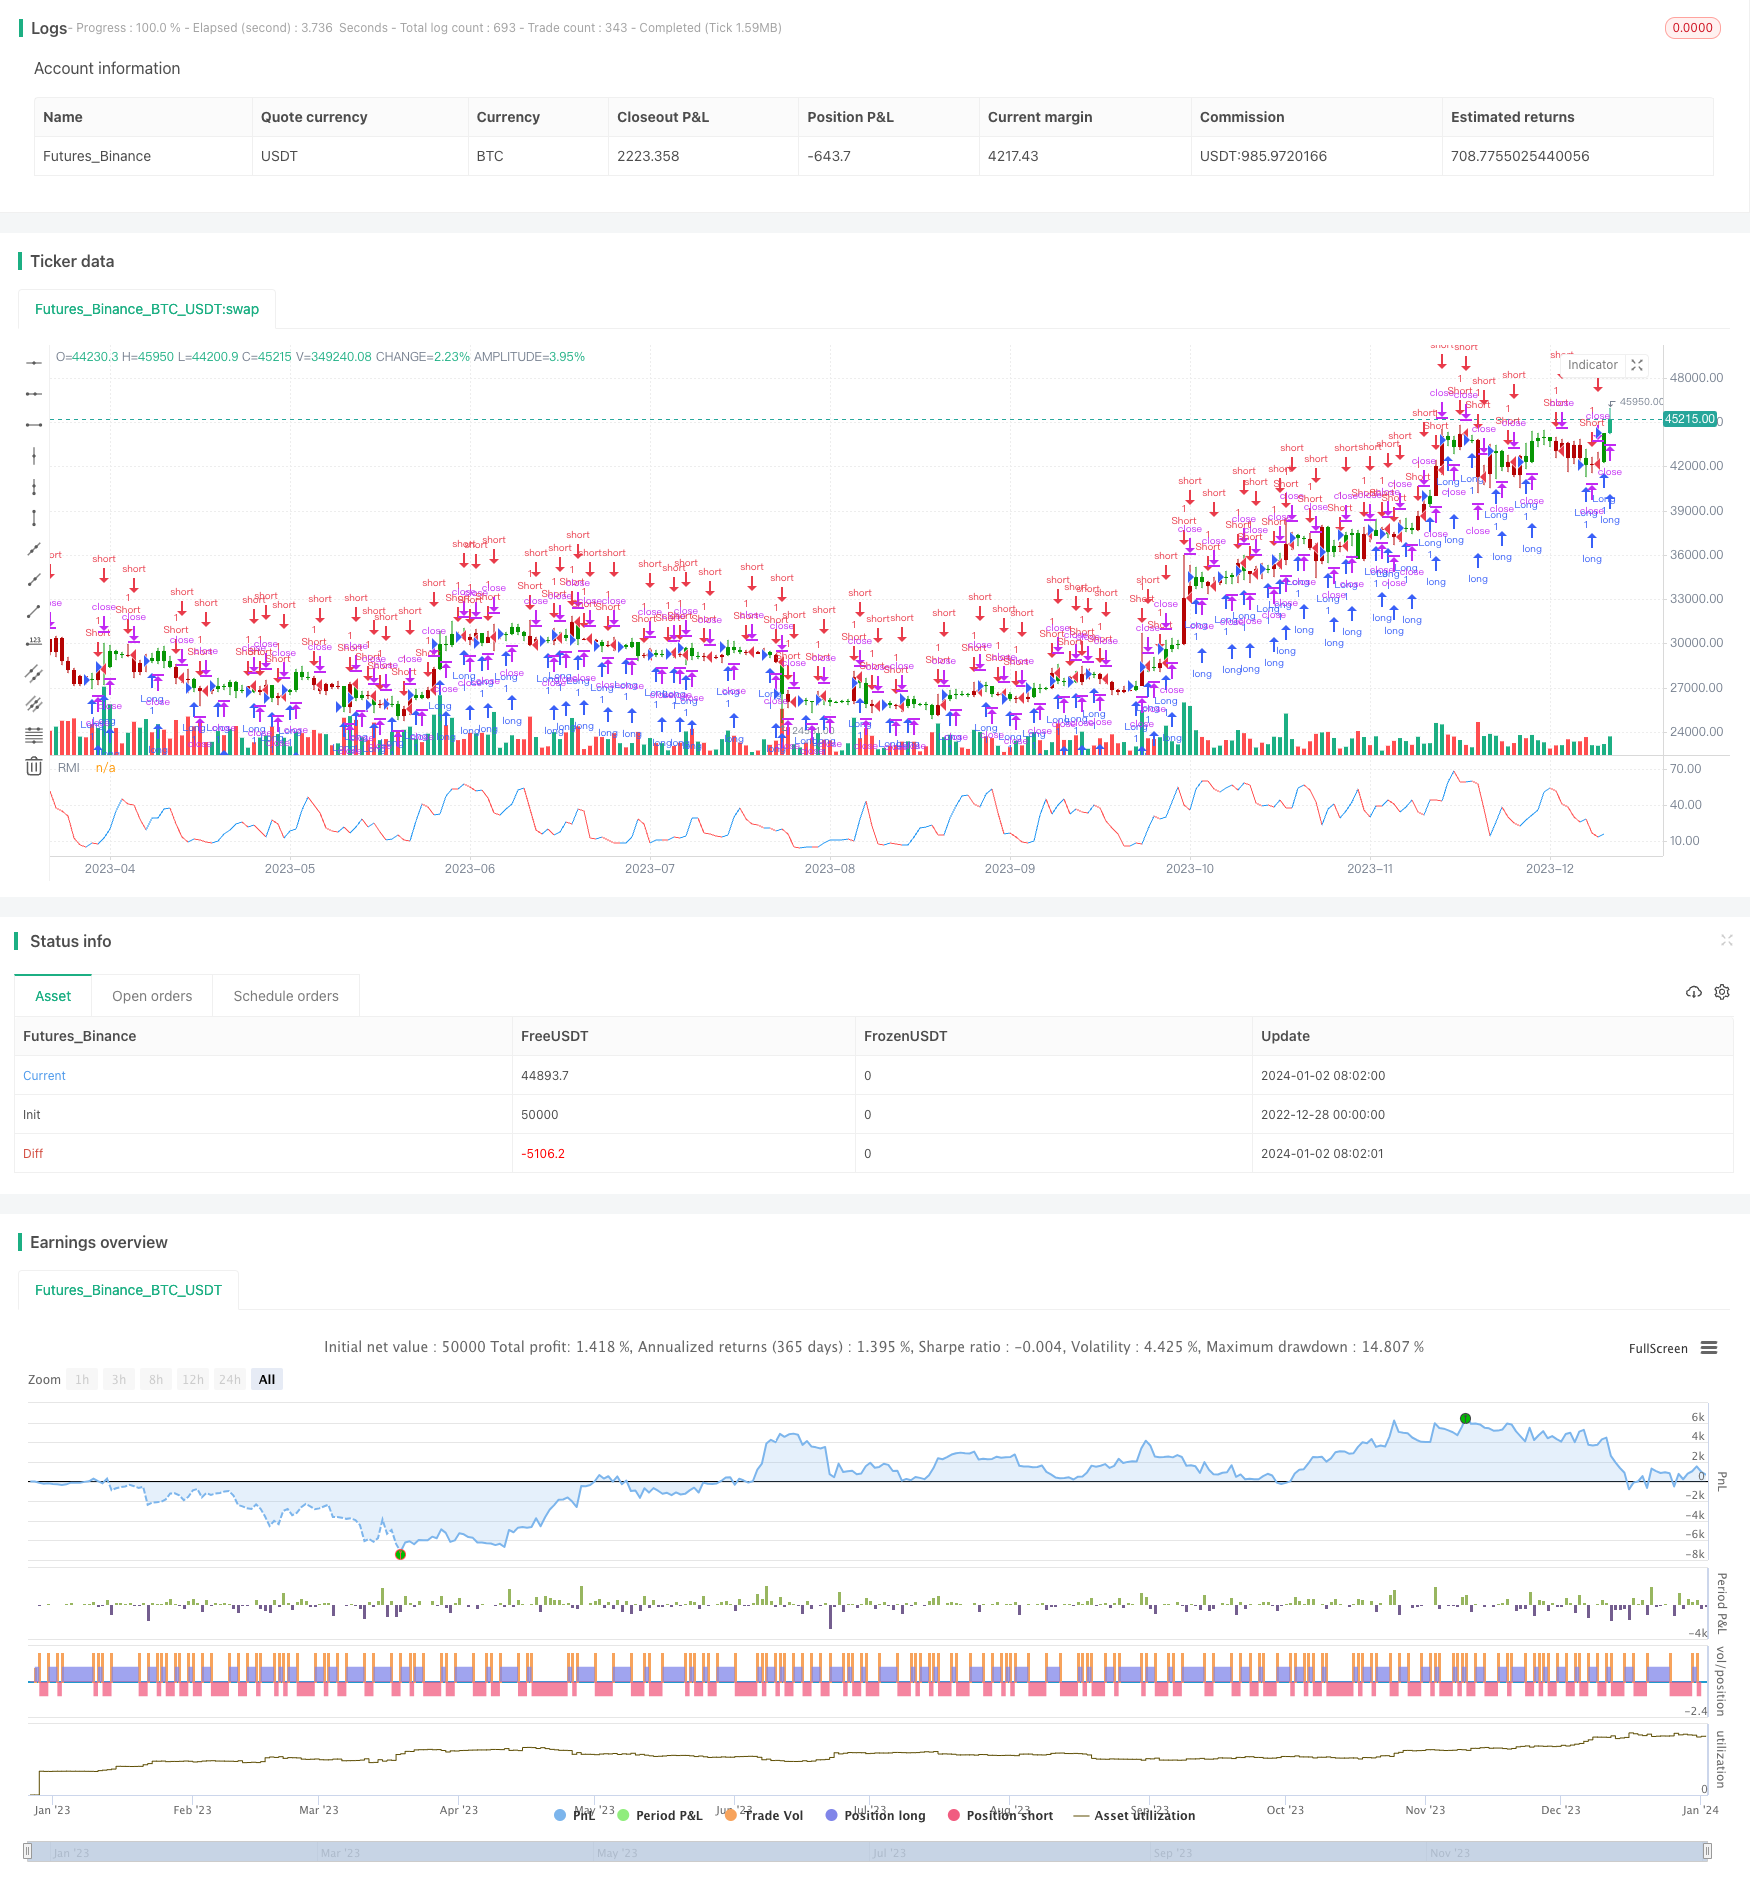
モメンタム・トレンド・トラッキング・ストラテジー (Momentum Trend Tracking Strategy) は,相対強度指数 (RSI),ランダム指数 (Stochastic) とモメンタム・トレンド・インジケーター (Momentum) を用いてトレンドを識別するストラテジーである.複数の指標信号を統合し,反測効果が良好で,中長線保持に適している.
戦略原則
この策略は,まず,それぞれ9サイクル長さのRSI,ストキャスティック,およびモメンタム指標を計算し,ストキャスティックとRSIの値を掛け,モメンタムで割ると,KNRPという総合指標が得られます.この指標は,複数の子指標の情報を同時に反映します.
その後,KNRPの長さ2の移動平均を求め,その上に穿越する穿越が取引信号を生成する.すなわち,平均値が前回より大きい時は多し,前回より小さい時は空である.この信号は,KNRP指標の短期的な傾向を反映する.
優位分析
この戦略の最大の利点は,指標の設計が合理的で,複数の技術指標の情報を効果的に統合することで,トレンドの方向性を正確に判断できるということです.単一の指標と比較して,誤信号の確率を減らすことで,信号の信頼性を高めます.
また,この戦略は,KNRPの移動平均をトレンド判断の主要な根拠とし,高殺低を追うリスクを避け,トレンド取引の理念に合致する.さらに,パラメータの設定は柔軟であり,ユーザーは自分のスタイルに合わせて調整することができます.
リスク分析
この戦略の主なリスクは,複数の指標の組み合わせそのものである.組み合わせ方法が不適切であれば,異なる指標の間で衝突が起こりうる.これは誤信号を増やして,戦略のパフォーマンスを影響する.さらに,パラメータの設定が不適切であれば,結果にも大きな影響を与える.
リスクを軽減するために,パラメータを最適化することを推奨し,異なる長さや組み合わせのパラメータが戦略指標と全体的なフィットネス結果に与える影響をテストする.また,長期的な状況がパラメータの安定性に与える影響にも注意する必要がある.
最適化の方向
この戦略は,以下のような点で最適化できます.
より多くの種類の技術指標の組み合わせをテストし,より効果的にトレンドを判断する方法を探します.
インデクタのパラメータを最適化し,現在の市場環境に適した値を見つけます.
ストップ・ロズとストップ・ストップ・ロジックが追加され,利益を固定し,損失を減らす.
日線や周線などのより長い時間周期でテストし,中長線戦略としての効果を評価する
ポジション管理モジュールを追加し,市場状況に応じてポジションを調整します.
要約する
動的トレンド追跡戦略は,全体的に比較して安定的で信頼性の高いトレンド戦略である.単一の指標が偽信号の影響を受けやすいという欠点を解決し,多指標を重み付けることでトレンドを効果的に判断する.パラメータ設定の柔軟性,最適化スペースが大きく,技術指標トレーダーに適している.この戦略は,さらに完善されれば,長期にわたって保有する価値のある量化戦略になる可能性がある.
/*backtest
start: 2022-12-28 00:00:00
end: 2024-01-03 00:00:00
period: 1d
basePeriod: 1h
exchanges: [{"eid":"Futures_Binance","currency":"BTC_USDT"}]
*/

//@version=4
////////////////////////////////////////////////////////////
//  Copyright by HPotter v1.0 27/07/2021
// To calculate the coordinates in which the kink of the line will cross,
//the standard Forex instruments are used - Relative Strenght Index, Stochastic and Momentum.
//It is very easy to optimize them for the existing trading strategy: they all have very
//flexible and easily customizable parameters. Signals to enter the market can be 2 situations:
//    Change of color of the indicator line from red to blue. At the same time, it is worth entering into the purchase;
//    Change of color of the indicator line from blue to red. In this case, it is worth entering for sale.
//The signals are extremely clear and can be used in practice even by beginners. The indicator
//itself shows when to make deals: the user only has to accompany them and set the values
//of Take Profit and Stop Loss. As a rule, the signal to complete trading is the approach of
//the indicator level to the levels of the maximum or minimum of the previous time period.
////////////////////////////////////////////////////////////
strategy(title="Kwan NRP Backtest", shorttitle="KNRP")
xPrice = open
Length_Momentum = input(9, minval=1)
Length_RSI = input(9, minval=1)
Length_Stoch = input(9, minval = 1)
Length_NRP = input(2, minval=1)
reverse = input(false, title="Trade reverse")
var xKNRP = array.new_float(1,na)
xMom = close / close[Length_Momentum] * 100
xRSI = rsi(xPrice, Length_RSI)
xStoch = stoch(xPrice, high, low, 9)
if xMom != 0
    val=xStoch*xRSI/xMom
    array.push(xKNRP,val)
    nz(na)
avr = 0.0
if array.size(xKNRP) > Length_NRP
    for i = array.size(xKNRP)-Length_NRP to array.size(xKNRP)-1
	    avr+= array.get(xKNRP, i)
    nz(na)
avr := avr / Length_NRP
clr = avr > avr[1] ? color.blue : color.red
pos = iff(avr > avr[1] , 1,
	   iff(avr < avr[1], -1, 0))
possig = iff(reverse and pos == 1, -1,
          iff(reverse and pos == -1 , 1, pos))
if (possig == 1 )
    strategy.entry("Long", strategy.long)
if (possig == -1 )
    strategy.entry("Short", strategy.short)
if (possig == 0)
    strategy.close_all()
barcolor(possig == -1 ? #b50404: possig == 1 ? #079605 : #0536b3 )
plot(avr, color=clr, title="RMI")