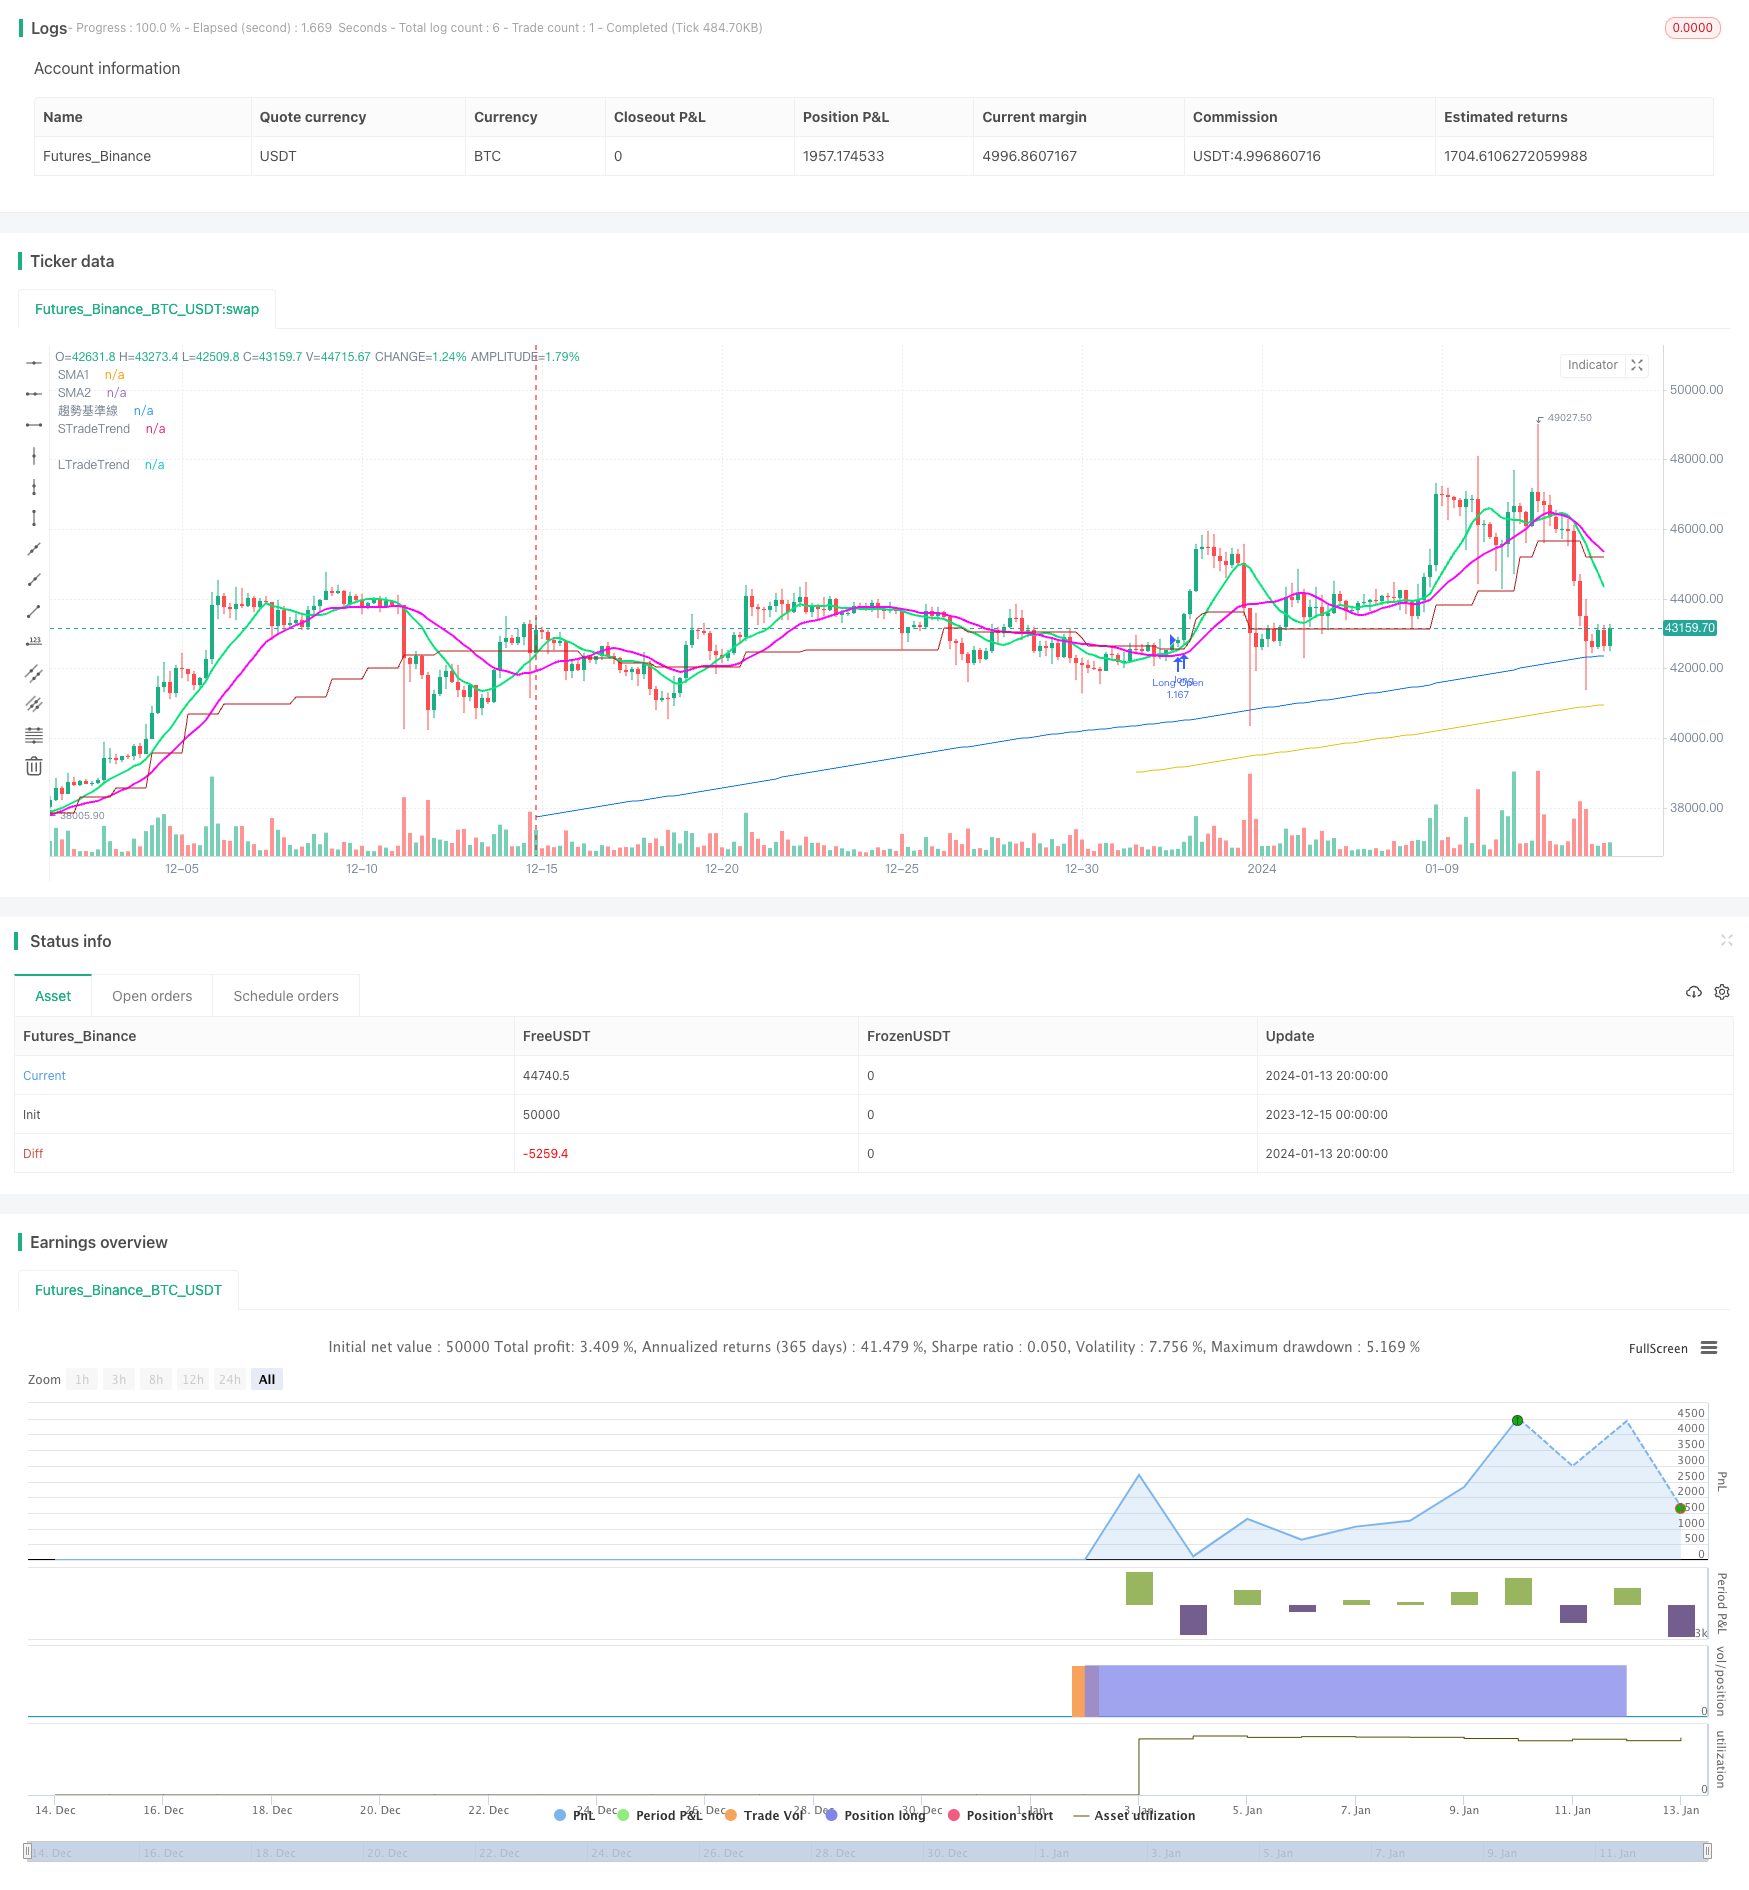
ロングとショートのデュアルトラックに基づくトレーリング利益獲得戦略

Myo_LS_Dの量化策
概要
Myo_LS_D定量化戦略は,多空双線に基づく追跡停止戦略である.この戦略は,平均線,価格突破,リスク・リターン比率などの複数の指標を総合的に利用して取引信号を構築する.傾向判断の正確さを前提に,高い勝率と利益率を実現する.
戦略原則
この戦略は,トレンド判断モジュール,複数モジュール,空白モジュール,追跡停止モジュールなどで構成されています.
トレンド判断モジュールは,ドンチェーンの通路を使用して,全体的なトレンドの方向を判断する.多入は上昇傾向にあることを前提として,空調は下降傾向にある必要があります.
複数モジュールでは,新しい高点,低点,長線平均線位置などの要素が考慮されます.空きモジュールでは,新しい高点,低点,短線平均線位置などの要素が考慮されます.これは,上方または下方突破の重要な価格点のときにポジションを確立することを保証します.
ストップトラッキングモジュールは,2つの異なる周期のSMA平均線を使用して,価格変化をリアルタイムで追跡する.価格が平均線を下回ったときに平仓ストップする.このリアルタイムトラッキングは,トレンド中の利益を最大化することができます.
止損設定は,止損を拡大して,止損点がサポート位から遠く離れていることを確認し,震えを避ける.
優位分析
この戦略の最大の利点は,多空分離倉庫の建設であり,ストップストップ戦略を追跡することである.具体的には,主に以下のようなものによって表される.
多空間の分離は,一方的なトレンドから利益を得る機会を最大化します.
トラッキングストップは,リアルタイム調整により,より高い率を得ることができます.従来のストップ方法と比較して,収益は著しく向上します.
ストップを拡大することで,震災の確率を低くし,損失のリスクを低減する.
リスクと解決
この戦略の主なリスクは以下の通りです.
トレンド判断に誤りが生じ,逆勢でポジション構築の損失を引き起こす可能性がある。ドンチェーンのパラメータを適切に調整するか,他の指標判断を追加して最適化することができる。
追跡ストップは過度に激しく,早期ストップは持続的に利益を得られない可能性があります. ストップ平均線間隔を適切に拡張して最適化することができます.
止損範囲が小さすぎると,震災の可能性が増加するかもしれない. 止損幅を適切に拡大してリスクを低減することができる.
最適化の方向
この戦略は以下の点で改善できる:
トレンド判断モジュールを最適化し,判断精度を高めます.MACDなどのより多くの指標を組み合わせることを検討できます.
ストップを追跡する方法を調整し,さらに利益の余地を広げます.例えば,ストップラインを比例して移動することができます.
ストップ範囲を拡大するか,ストップを縮小して,震の可能性をさらに低減することを検討する.
種によってパラメータが異なるので,最適なパラメータの組み合わせを得るためにトレーニングすることができます.
要約する
Myo_LS_D戦略は,全体的に比較的に成熟した安定した多空追跡停止戦略である.その優位性は明白で,リスクは制御可能であり,長期にわたって使用する価値のある量化方案の1つです.将来,さらなる最適化によって,その収益性能が継続的に向上させられ,より優れた量化戦略になる可能性があります.
/*backtest
start: 2023-12-15 00:00:00
end: 2024-01-14 00:00:00
period: 4h
basePeriod: 15m
exchanges: [{"eid":"Futures_Binance","currency":"BTC_USDT"}]
*/

// This source code is subject to the terms of the Mozilla Public License 2.0 at https://mozilla.org/MPL/2.0/
// © agresiynin

//@version=5
// ©Myo_Pionex
strategy(
 title                  =   "Myo_simple strategy_LS_D",
 shorttitle             =   "Myo_LS_D",
 overlay                =   true )


// var
lowest_price = ta.lowest(low, 200)
highest_price = ta.highest(high, 200)
min_800 = ta.lowest(low, 800)
max_800 = ta.highest(high, 800)
tp_target_L = min_800 + (max_800 - min_800) * math.rphi
tp_target_S = max_800 - (max_800 - min_800) * math.rphi
sl_length_L = input.int(100, "做多的止損長度", minval = 50, maxval = 300, step = 50)
sl_length_S = input.int(100, "做空的止損長度", minval = 50, maxval = 300, step = 50)
sl_L = lowest_price * (1 - 0.005)
sl_S = highest_price * (1 + 0.005)
rrr_L = tp_target_L - sl_L / sl_L
rrr_S = ta.lowest(low, 800) + ta.highest(high, 800) - ta.lowest(low, 800) * math.rphi / ta.highest(high, 200) + 0.005 * ta.highest(high, 200) - ta.lowest(low, 200) - 0.005 * ta.lowest(low, 200)
smalen1 = input.int(10, "做多追蹤止盈SMA長度1", options = [5, 10, 20, 40, 60, 80])
smalen2 = input.int(20, "做多追蹤止盈SMA長度2", options = [5, 10, 20, 40, 60, 80])
smalen1_S = input.int(5, "做空追蹤止盈SMA長度1", options = [5, 10, 20, 40, 60, 80])
smalen2_S = input.int(10, "做空追蹤止盈SMA長度2", options = [5, 10, 20, 40, 60, 80])
TrendLength_L = input.int(400, "做多趨勢線", options = [100, 200, 300, 400, 500])
TrendLength_S = input.int(300, "做空趨勢線", options = [100, 200, 300, 400, 500])
SMA1 = ta.sma(close, smalen1)
SMA2 = ta.sma(close, smalen2)
SMA1_S = ta.sma(close, smalen1_S)
SMA2_S = ta.sma(close, smalen2_S)
shortlength = input.int(20, "短期均價K線數量")
midlength = input.int(60, "中期均價K線數量")
longlength = input.int(120, "長期均價K線數量")
ShortAvg = math.sum(close, shortlength)/shortlength
MidAvg = math.sum(close, midlength)/midlength
LongAvg = math.sum(close, longlength)/longlength

// Trend
basePeriods = input.int(8, minval=1, title="趨勢基準線")
basePeriods_Short = input.int(26, "做空基準線")
donchian(len) => math.avg(ta.lowest(len), ta.highest(len))
baseLine = donchian(basePeriods)
baseLine_Short = donchian(basePeriods_Short)
trend = request.security(syminfo.tickerid, "D", baseLine)
isUptrend = false
isDowntrend = false
baseLine_D = request.security(syminfo.tickerid, "D", baseLine)
plot(baseLine_D, color=#B71C1C, title="趨勢基準線")
if close[0] > baseLine_D
    isUptrend := true
if close[0] < baseLine_Short
    isDowntrend := true
// Long
// Condition
// entry
con_a = low > lowest_price ? 1 : 0
con_b = high > highest_price ? 1 : 0
con_c = close[0] > ta.sma(close, TrendLength_L) ? 1 : 0
con_d = isUptrend ? 1 : 0
con_e = rrr_L > 3 ? 1 : 0
con_a1 = close[0] > ShortAvg[shortlength] ? 1 : 0
con_b1 = close[0] > MidAvg[midlength] ? 1 : 0

// close
con_f = ta.crossunder(close, SMA1) and ta.crossunder(close, SMA2) ? 1 : 0
con_g = close < ta.lowest(low, sl_length_L)[1] * (1 - 0.005) ? 1 : 0

// exit
con_h = tp_target_L

// Main calculation
LongOpen = false
AddPosition_L = false

if con_a + con_b + con_c + con_e + con_a1 + con_b1 >= 4 and con_d >= 1
    LongOpen := true
// Short
// Condition
// entry
con_1 = high < highest_price ? 1 : 0
con_2 = low < lowest_price ? 1 : 0
con_3 = close[0] < ta.sma(close, TrendLength_S) ? 1 : 0
con_4 = isDowntrend ? 1 : 0
con_5 = rrr_S > 3 ? 1 : 0
con_11 = close[0] < ShortAvg[shortlength] ? 1 : 0
con_12 = close[0] < MidAvg[midlength] ? 1 : 0

// close
con_6 = ta.crossover(close, SMA1_S) and ta.crossover(close, SMA2_S) ? 1 : 0
con_7 = close > ta.highest(high, sl_length_S)[1] * (1 + 0.005) ? 1 : 0

// exit
con_8 = tp_target_S

// Main calculation
ShortOpen = false
AddPosition_S = false

if con_1 + con_2 + con_3 + con_4 + con_5 + con_11 + con_12 >= 5
    ShortOpen := true

//
// execute
//
strategy.initial_capital = 50000
if strategy.position_size == 0
    if LongOpen
        strategy.entry("Long Open" , strategy.long , comment= "Long Open " + str.tostring(close[0]), qty=strategy.initial_capital/close[0])

if strategy.position_size > 0
    if (con_f > 0 or con_g > 0 or ShortOpen) and close <= baseLine_D
        strategy.close_all(comment="Close Long " + str.tostring(close[0]))

if strategy.position_size == 0
    if ShortOpen
        strategy.entry("Short Open" , strategy.short , comment= "Short Open " + str.tostring(close[0]), qty=strategy.initial_capital/close[0])

if strategy.position_size < 0
    if (con_6 > 0 or con_7 > 0 or LongOpen) and close >= baseLine_D
        strategy.close_all(comment="Close Short " + str.tostring(close[0]))


plot(ta.sma(close, TrendLength_L), color=#e5c212, title="LTradeTrend")
plot(ta.sma(close, TrendLength_S), color=#1275e5, title="STradeTrend")
plot(SMA1, "SMA1", color = color.lime, linewidth = 2)
plot(SMA2, "SMA2", color = color.rgb(255, 0, 255), linewidth = 2)