ADXインジケーターに基づく適応型取引戦略
概要
この戦略の核心は,市場トレンドを判断するためにADX指標を使用し,DI+-指標の差値と自動で突破点を識別し,自主取引を実現することです.DI+とADXの差値が設定された値を超えると多し,DI-とADXの差値が設定された値を超えると空になります.この戦略は,人工の介入を必要とせずに,トレンドの突破点を自動的に識別し,中長線保持に適しています.
戦略原則
True Range,Directional Movementの指標を計算し,DI+,DI-,DX,ADXなどの指標が得られる.
DI+とADXの差値アンプリチュード1とDI-とADXの差値アンプリチュード2を比較する.
振幅1が設定値 (例えば10) よりも大きいときは多信号を生成し,振幅2が設定値 (例えば10) よりも大きいときは空白信号を生成する.
ADXはDI+とDI−の間を誤信号をフィルターするために要求する.
このように,市場がトレンド状態に入ると,DI+またはDI-は明らかにADXを先導して取引信号を生じます.市場がトレンド状態を終了すると,DI+,DI-およびADXは再び接近し,高殺低を追求するのを避ける.
戦略的優位性
自動でトレンドの突破点を識別し,人工判断は不要です.
DIとADXの差値の値下げを柔軟に調整し,異なる市場環境に適応する.
ADX指標と組み合わせると,誤信号を効果的にフィルタリングできる.
持株期間が長く,高頻度取引が不要で,資金使用率が高い.
撤退は制御可能で,成長は安定している.
戦略リスク
ADX指標は遅滞し,ショートラインの取引機会を逃す可能性があります.他の指標と組み合わせたり,ADXパラメータを小さくして感度を増やすことができます.
振動的な状況で容易く套用される. ストップ・ローズ戦略を導入するか,ADXフィルタリング条件を追加して套用の可能性を減らすことができる.
大幅なトレンドの逆転で大きな損失を被る. 移動ストップまたは追跡ストップを設定してリスクをコントロールできます.
戦略の最適化
異なる市場や品種をテストし,最適なパラメータの組み合わせを調整できます.
他の指標判断と組み合わせて信号の精度を向上させることが考えられる.例えばMACD,KDなど.
撤退と最大損失を制御するストップ・ローズ戦略を追加する.
ポジション管理を導入し,市場の状況に応じて取引ポジションを調整する.
取引のリスクを減らすために,エントリーポイントの選択と出場条件の最適化.
要約する
この戦略はADXとDIの指標の優位性を統合し,トレンドを効果的に判断し,自主的に取引を可能にします.頻繁な操作を必要とせず,中長線保有に適しています.同時に,一定のリスクがあり,補助的な技術指標と資金管理手段を加える必要があり,戦略の安定性を大幅に向上させることができます.この戦略の考え方は信頼性があり,論理的に明確であり,研究と応用を深める価値があります.
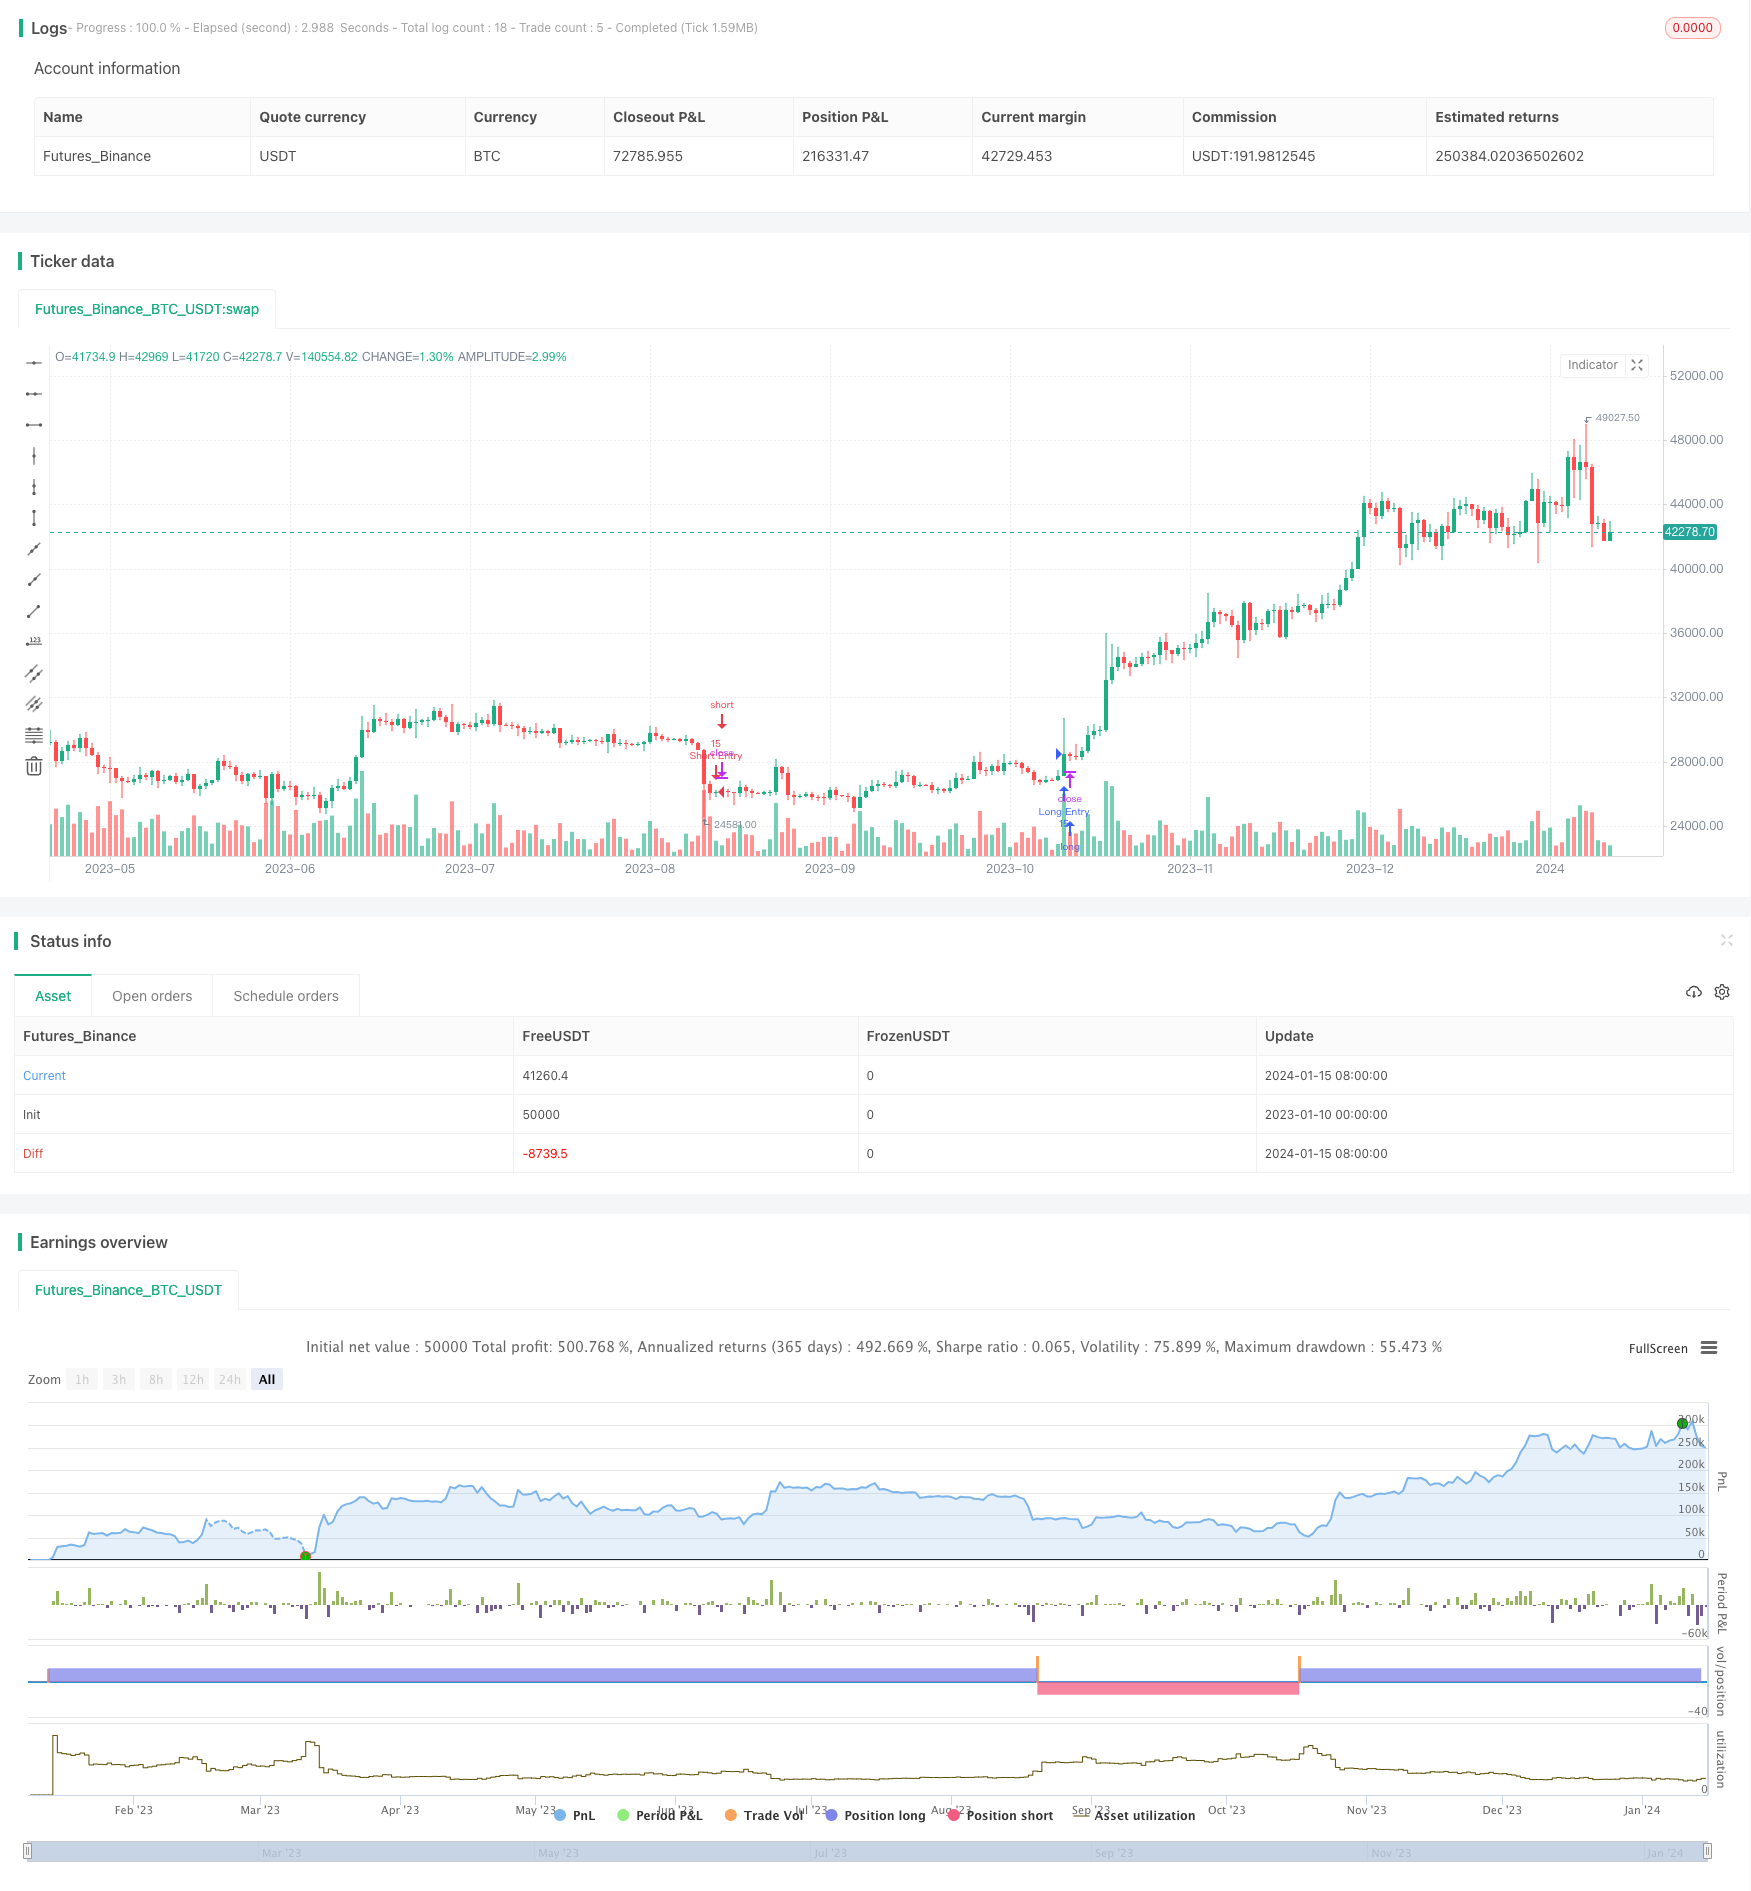
/*backtest
start: 2023-01-10 00:00:00
end: 2024-01-16 00:00:00
period: 1d
basePeriod: 1h
exchanges: [{"eid":"Futures_Binance","currency":"BTC_USDT"}]
*/

// This source code is subject to the terms of the Mozilla Public License 2.0 at https://mozilla.org/MPL/2.0/
// © MAURYA_ALGO_TRADER

//@version=5
strategy("Monthly Performance by Dr. Maurya", overlay=true, default_qty_value = 15, commission_type = strategy.commission.percent, commission_value = 0.1)


len = input(14)
th = input(20)

TrueRange = math.max(math.max(high - low, math.abs(high - nz(close[1]))), math.abs(low - nz(close[1])))
DirectionalMovementPlus = high - nz(high[1]) > nz(low[1]) - low ? math.max(high - nz(high[1]), 0) : 0
DirectionalMovementMinus = nz(low[1]) - low > high - nz(high[1]) ? math.max(nz(low[1]) - low, 0) : 0

SmoothedTrueRange = 0.0
SmoothedTrueRange := nz(SmoothedTrueRange[1]) - nz(SmoothedTrueRange[1]) / len + TrueRange

SmoothedDirectionalMovementPlus = 0.0
SmoothedDirectionalMovementPlus := nz(SmoothedDirectionalMovementPlus[1]) - nz(SmoothedDirectionalMovementPlus[1]) / len + DirectionalMovementPlus

SmoothedDirectionalMovementMinus = 0.0
SmoothedDirectionalMovementMinus := nz(SmoothedDirectionalMovementMinus[1]) - nz(SmoothedDirectionalMovementMinus[1]) / len + DirectionalMovementMinus

DIPlus = SmoothedDirectionalMovementPlus / SmoothedTrueRange * 100
DIMinus = SmoothedDirectionalMovementMinus / SmoothedTrueRange * 100
DX = math.abs(DIPlus - DIMinus) / (DIPlus + DIMinus) * 100
ADX = ta.sma(DX, len)


//diff_1 = math.abs(DIPlus - DIMinus)
diff_2 = math.abs(DIPlus-ADX)
diff_3 = math.abs(DIMinus - ADX)

long_diff = input(10, "Long Difference")
short_diff = input(10, "Short Difference")

buy_condition = diff_2 >=long_diff and diff_3 >=long_diff and (ADX < DIPlus and ADX > DIMinus)
sell_condition = diff_2 >=short_diff and diff_3 >=short_diff and (ADX > DIPlus and ADX < DIMinus)


if buy_condition
    strategy.entry("Long Entry", strategy.long, comment = "Long")
if sell_condition
    strategy.entry("Short Entry", strategy.short, comment = "Short")


// Copy below code to end of the desired strategy script
///////////////////////////////////////////////////////////////////////////////////////////////////////////////////////
//                                 monthly pnl performance  by Dr. Maurya @MAURYA_ALGO_TRADER                        //
///////////////////////////////////////////////////////////////////////////////////////////////////////////////////////
show_performance = input.bool(true, 'Show Monthly Monthly Performance ?', group='Monthly Performance')

dash_loc_mp = input("Bottom Right","Location"  ,options=["Top Right","Bottom Right","Top Left","Bottom Left", "Middle Right","Bottom Center"]  ,group='Monthly Performance', inline = "performance")

text_size_mp = input('Small',"Size"  ,options=["Tiny","Small","Normal","Large"]  ,group='Monthly Performance', inline = "performance")

bg_c = input.color( color.rgb(7, 226, 242, 38), "Background Color", group='Monthly Performance')

text_head_color = input.color( color.rgb(0,0,0), "Month/Year Heading Color", group='Monthly Performance')

tab_month_c = input.color( color.white, "Month PnL Data Color", group='Monthly Performance')

tab_year_c = input.color( color.rgb(0,0,0), "Year PnL Data Color", group='Monthly Performance')

border_c = input.color( color.white, "Table Border Color", group='Monthly Performance')


var table_position_mp = dash_loc_mp == 'Top Left' ? position.top_left :
  dash_loc_mp == 'Bottom Left' ? position.bottom_left :
  dash_loc_mp == 'Middle Right' ? position.middle_right :
  dash_loc_mp == 'Bottom Center' ? position.bottom_center :
  dash_loc_mp == 'Top Right' ? position.top_right : position.bottom_right

var table_text_size_mp = text_size_mp == 'Tiny' ? size.tiny :
  text_size_mp == 'Small' ? size.small :
  text_size_mp == 'Normal' ? size.normal : size.large

/////////////////
strategy.initial_capital =50000

/////////////////////////////////////////////

// var bool new_month = na
new_month = ta.change(month) //> 0 ? true : false
newest_month = new_month and strategy.closedtrades >= 1

// profit
only_profit = strategy.netprofit
initial_balance = strategy.initial_capital

// month number
var int month_number = na
month_number := (ta.valuewhen(newest_month, month(time), 0)) //and month(time) > 1 ? (ta.valuewhen(newest_month, month(time), 0) - 1) :  12 //1 to 12

//month_year
var int month_time = na
month_time := ta.valuewhen(newest_month, time, 0) - 2419200000


var int m_counter = 0
if newest_month
    m_counter += 1


// current month values
var bool new_year = na
new_year := ta.change(year)
curr_m_pnl = only_profit - nz(ta.valuewhen(newest_month, only_profit, 0), 0)
curr_m_number = newest_month ? ta.valuewhen(newest_month, month(time), 0) : month(time)
curr_y_pnl = (only_profit - nz(ta.valuewhen(new_year, only_profit, 0),0))


var float [] net_profit_array = array.new_float()
var int [] month_array = array.new_int()
var int [] month_time_array = array.new_int()


if newest_month
    array.push(net_profit_array, only_profit)
    array.push(month_array, month_number)
    array.push(month_time_array, month_time)


var float [] y_pnl_array = array.new_float()
var int [] y_number_array = array.new_int()
var int [] y_time_array = array.new_int()

newest_year = ta.change(year) and strategy.closedtrades >= 1
get_yearly_pnl = nz(ta.valuewhen(newest_year, strategy.netprofit, 0) - nz(ta.valuewhen(newest_year, strategy.netprofit, 1), 0), 0)
get_m_year = ta.valuewhen(newest_year, year(time), 1)
get_y_time = ta.valuewhen(newest_year, time, 0)

if newest_year
    array.push(y_pnl_array, get_yearly_pnl)
    array.push(y_number_array, get_m_year)
    array.push(y_time_array, get_y_time)
var float monthly_profit = na
var int column_month_number = na
var int row_month_time = na


var testTable = table.new(position = table_position_mp, columns = 14, rows = 40, bgcolor = bg_c, border_color = border_c, border_width = 1)
if barstate.islastconfirmedhistory and show_performance
    table.cell(table_id = testTable, column = 0, row = 0, text = "YEAR", text_color = text_head_color, text_size=table_text_size_mp)
    table.cell(table_id = testTable, column = 1, row = 0, text = "JAN", text_color = text_head_color, text_size=table_text_size_mp)
    table.cell(table_id = testTable, column = 2, row = 0, text = "FEB", text_color = text_head_color, text_size=table_text_size_mp)
    table.cell(table_id = testTable, column = 3, row = 0, text = "MAR", text_color = text_head_color, text_size=table_text_size_mp)
    table.cell(table_id = testTable, column = 4, row = 0, text = "APR", text_color = text_head_color, text_size=table_text_size_mp)
    table.cell(table_id = testTable, column = 5, row = 0, text = "MAY", text_color = text_head_color, text_size=table_text_size_mp)
    table.cell(table_id = testTable, column = 6, row = 0, text = "JUN", text_color = text_head_color, text_size=table_text_size_mp)
    table.cell(table_id = testTable, column = 7, row = 0, text = "JUL", text_color = text_head_color, text_size=table_text_size_mp)
    table.cell(table_id = testTable, column = 8, row = 0, text = "AUG", text_color = text_head_color, text_size=table_text_size_mp)
    table.cell(table_id = testTable, column = 9, row = 0, text = "SEP", text_color = text_head_color, text_size=table_text_size_mp)
    table.cell(table_id = testTable, column = 10, row = 0, text = "OCT", text_color = text_head_color, text_size=table_text_size_mp)
    table.cell(table_id = testTable, column = 11, row = 0, text = "NOV", text_color = text_head_color, text_size=table_text_size_mp)
    table.cell(table_id = testTable, column = 12, row = 0, text = "DEC", text_color =text_head_color, text_size=table_text_size_mp)
    table.cell(table_id = testTable, column = 13, row = 0, text = "YEAR P/L", text_color = text_head_color, text_size=table_text_size_mp)

    for i = 0 to (array.size(y_number_array) == 0 ? na : array.size(y_number_array) - 1)
        row_y = year(array.get(y_time_array, i)) - year(array.get(y_time_array, 0)) + 1
        table.cell(table_id = testTable, column = 13, row = row_y, text = str.tostring(array.get(y_pnl_array , i), "##.##") + '\n' + '(' + str.tostring(array.get(y_pnl_array , i)*100/initial_balance, "##.##") + ' %)', bgcolor = array.get(y_pnl_array , i) > 0 ? color.green : array.get(y_pnl_array , i) < 0 ? color.red : color.gray, text_color = tab_year_c, text_size=table_text_size_mp)
    curr_row_y = array.size(month_time_array) == 0 ? 1 : (year(array.get(month_time_array, array.size(month_time_array) - 1))) - (year(array.get(month_time_array, 0))) + 1
    table.cell(table_id = testTable, column = 13, row = curr_row_y, text = str.tostring(curr_y_pnl, "##.##") + '\n' + '(' + str.tostring(curr_y_pnl*100/initial_balance, "##.##") + ' %)', bgcolor = curr_y_pnl > 0 ? color.green : curr_y_pnl < 0 ? color.red : color.gray, text_color = tab_year_c, text_size=table_text_size_mp)


    for i = 0 to (array.size(net_profit_array) == 0 ? na : array.size(net_profit_array) - 1)
        monthly_profit := i > 0 ? ( array.get(net_profit_array, i) - array.get(net_profit_array, i - 1) ) : array.get(net_profit_array, i)
        column_month_number := month(array.get(month_time_array, i))
        row_month_time :=((year(array.get(month_time_array, i))) - year(array.get(month_time_array, 0)) ) + 1
        table.cell(table_id = testTable, column = column_month_number, row = row_month_time, text = str.tostring(monthly_profit, "##.##") + '\n' + '(' + str.tostring(monthly_profit*100/initial_balance, "##.##") + ' %)', bgcolor = monthly_profit > 0 ? color.green : monthly_profit < 0 ? color.red : color.gray, text_color = tab_month_c, text_size=table_text_size_mp)
        table.cell(table_id = testTable, column = 0, row =row_month_time, text = str.tostring(year(array.get(month_time_array, i)), "##.##"), text_color = text_head_color, text_size=table_text_size_mp)

    curr_row_m = array.size(month_time_array) == 0 ? 1 : (year(array.get(month_time_array, array.size(month_time_array) - 1))) - (year(array.get(month_time_array, 0))) + 1
    table.cell(table_id = testTable, column = curr_m_number, row = curr_row_m, text = str.tostring(curr_m_pnl, "##.##") + '\n' + '(' + str.tostring(curr_m_pnl*100/initial_balance, "##.##") + ' %)', bgcolor = curr_m_pnl > 0 ? color.green : curr_m_pnl < 0 ? color.red : color.gray, text_color = tab_month_c, text_size=table_text_size_mp)
    table.cell(table_id = testTable, column = 0, row =curr_row_m, text = str.tostring(year(time), "##.##"), text_color = text_head_color, text_size=table_text_size_mp)

//============================================================================================================================================================================