改善されたトレンドフォローモメンタムブレイクアウトトレンド戦略
概要
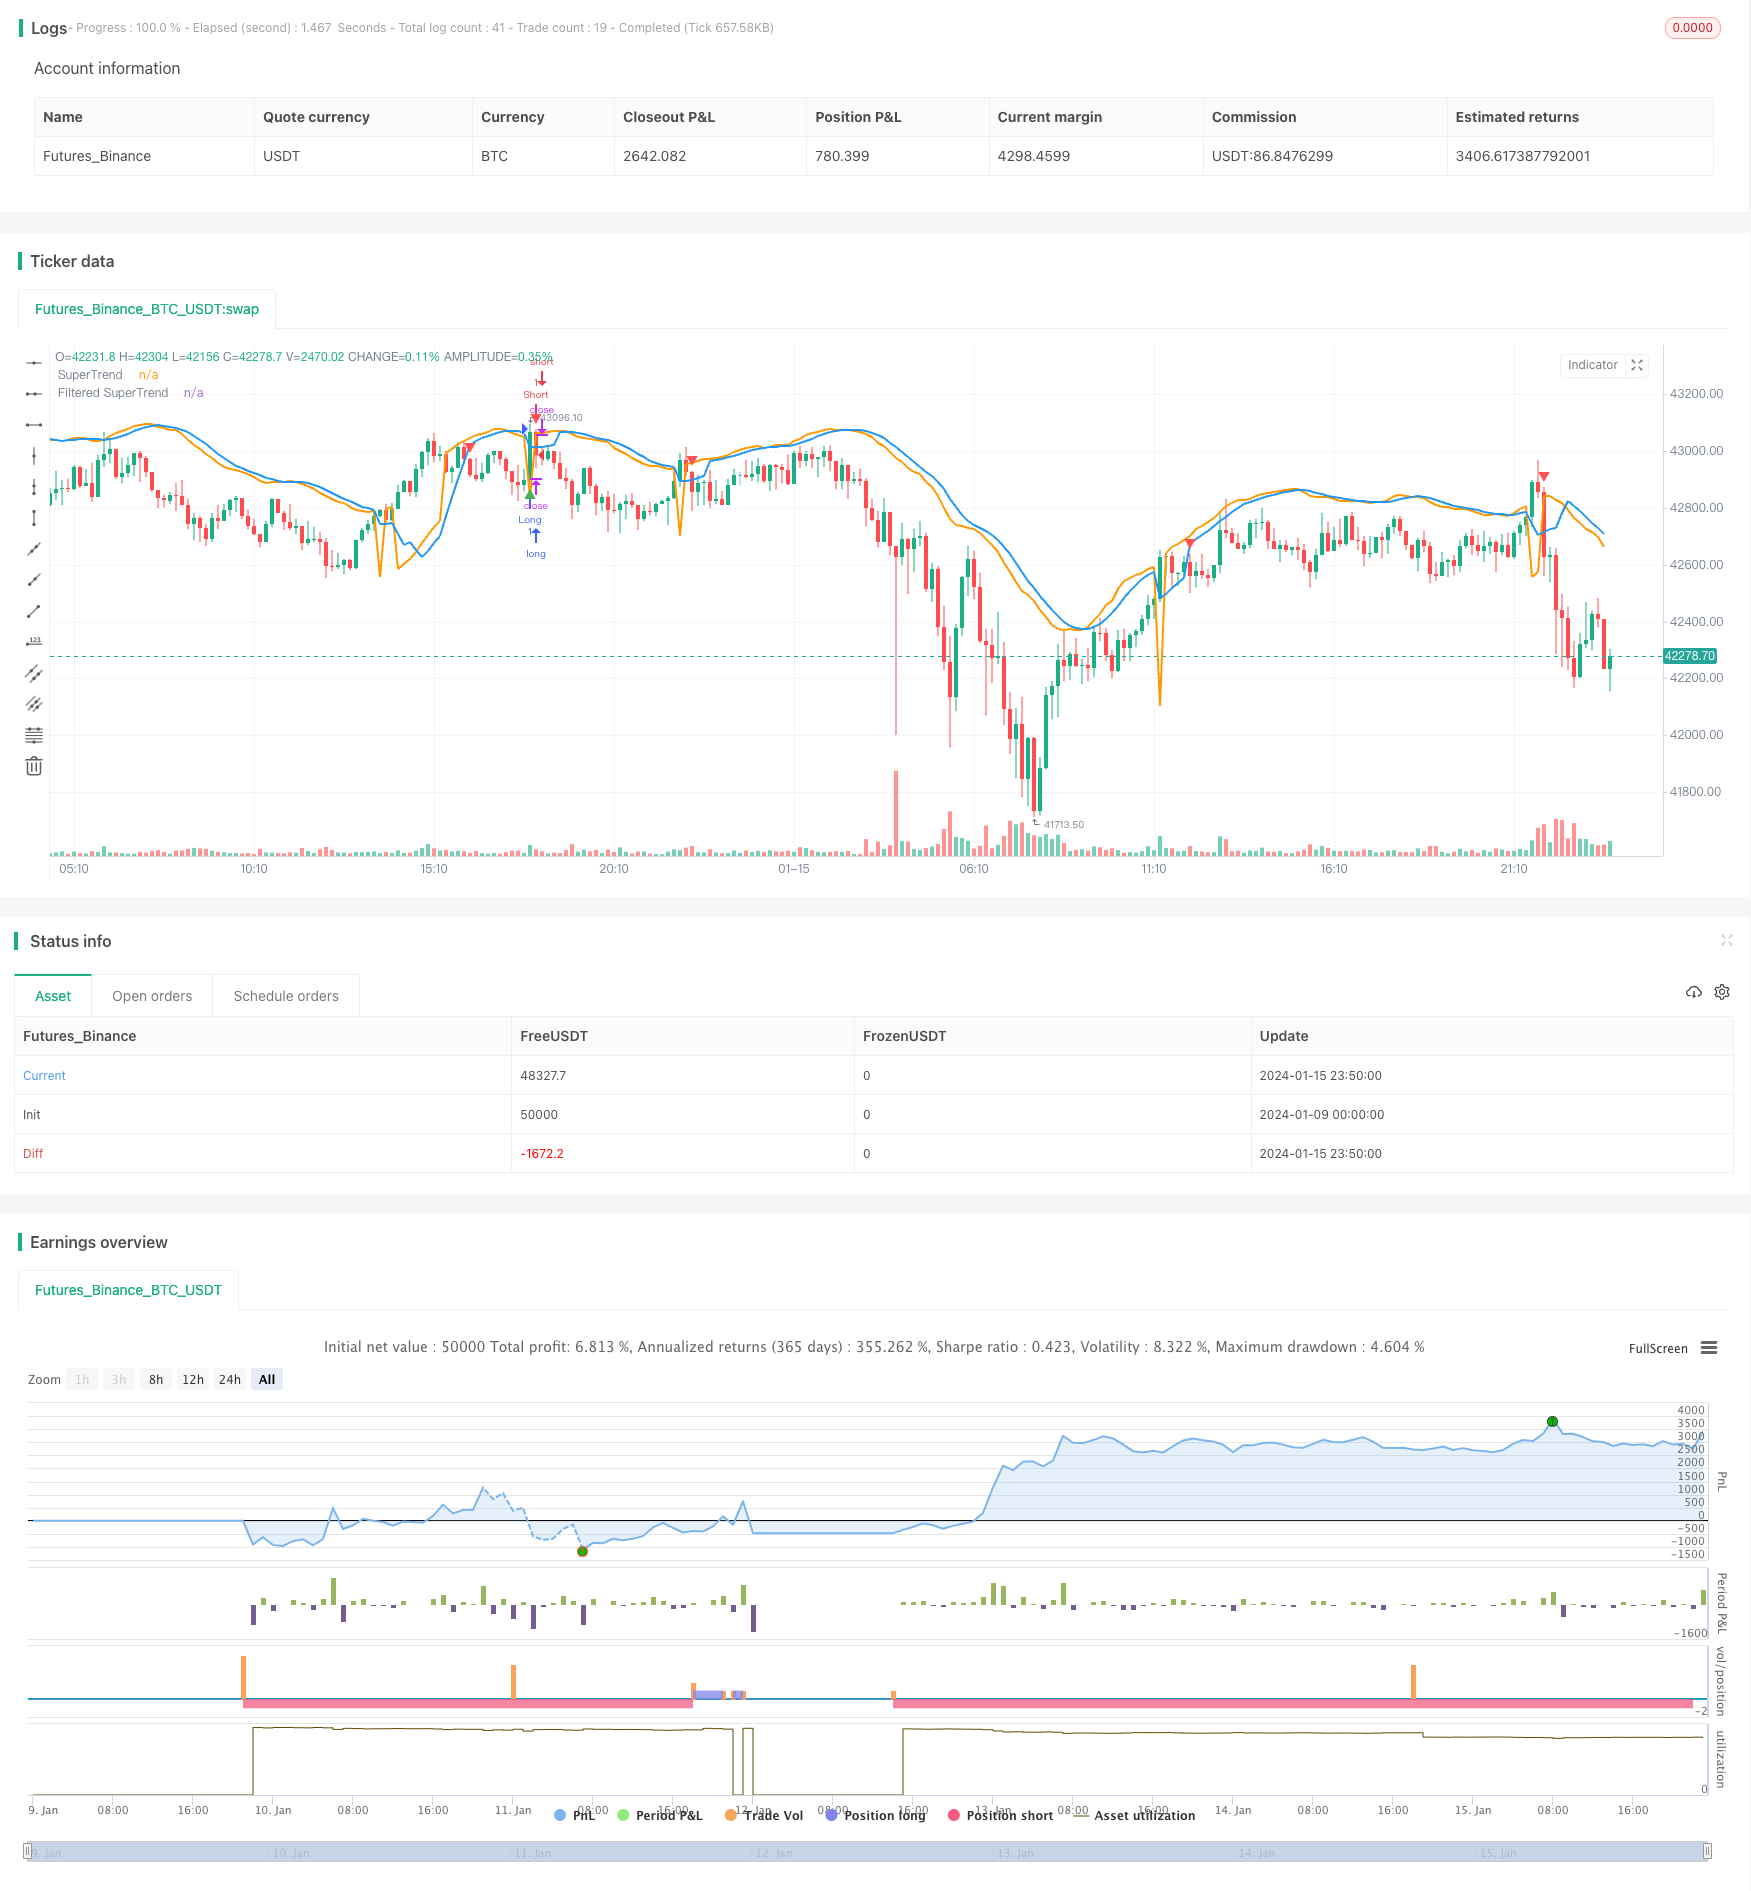
この記事では,スーパートレンド指標とストキャスティックRSIフィルターを組み合わせた改善されたトレンド追跡戦略を詳細に分析しています. この戦略は,市場動向を考慮し,偽信号を減らす一方で,買入と売却のシグナルを生成することを目的としています.
戦略原則
超トレンドの計算
まず,実際の波動範囲 (TR) と平均実際の波動範囲 (ATR) を計算して,ATRを使って上線と下線を計算する.
上線 = SMA ((閉盤価格,ATR周期) +ATRの倍数 × ATR 下線 = SMA ((閉盘価格,ATR周期) - ATRの倍数 × ATR
閉じる値が下位線より高い場合は,上昇傾向;閉じる値が上位線より低い場合は,下降傾向である. 上位線では,SuperTrendは下位線であり,下位線では,SuperTrendは上位線である.
フィルタリング
偽信号を減らすために,SuperTrendを移動平均でフィルターしたSuperTrendを取得します.
Stochastic RSI
RSIの値を計算し,ストキャスティック指数を使用してストキャスティックRSIを生成します. これはRSIが超買いまたは超売り領域にあるかどうかを反映します.
入学・退学条件
購入条件: 値上がり傾向の超トレンドが終了後,ストキャスティックRSI < 80 販売条件: 超トレンドの下落傾向で,収束価格が上昇後,ストキャスティックRSI > 20
買い出し: 超トレンドの終盤後,上昇傾向にある 売り切れる: 超トレンドが上昇し,下落傾向にある.
戦略的優位性
これはトレンドを追跡する改善策で,単純移動平均などの指標に比べて以下の利点があります.
- SuperTrendは,それ自体が強いトレンド認識能力と偽信号のフィルタリング能力を持っている.
- フィルタリングメカニズムの適用により,偽信号がさらに減少し,信号はより信頼性が高くなります.
- ストキャスティックRSIは,超買いと超売りで発生する偽信号を回避し,戦略が重要なサポートとレジスタンスエリアの近くで信号を発信することを可能にします.
- 戦略は,トレンドの方向とストキャスティックRSIの超買超売を考慮し,トレンドを追跡し,偽信号を避けるとの関係をよりよくバランスします.
- 戦略のパラメータは,異なる市場環境に適用して柔軟に調整できます.
リスクと最適化
リスク
- 市場が急激に波動している場合,ストップ・ロスは破られる可能性があります.
- 超トレンドとフィルタリングは遅れているので,最近の価格変化を見逃す可能性があります.
- ストキャスティックRSIのパラメータ設定が不適切であることも戦略のパフォーマンスに影響を与える.
リスク対策
- 適切な調整の停止または違反の停止を使用します.
- 参数ATR周期を調整し,遅滞をバランスするためにフィルター周期を調整する.
- ストキャスティックRSIのパラメータをテストし,最適化する.
最適化の方向
- 異なるパラメータの組み合わせをテストし,最適なパラメータを探します.
- EMA平滑などの異なるフィルタリングメカニズムを試してみてください.
- 機械学習アルゴリズムの自動最適化パラメータを適用する.
- 他の指標と組み合わせた補足入学基準
要約する
この戦略は,SuperTrendとStochastic RSIの2つの指標の優位性を統合し,トレンドを効果的に識別し,高品質の取引信号を発信します.また,フィルタリング機構は,市場騒音に対してより優位性を与えます.この戦略は,パラメータ最適化により,より良い戦略効果を得ることができます.また,他の指標またはモデルとの組み合わせも考慮することができます.全体的に,この戦略は,トレンドを追跡する能力が良好で,安定した収益を追求する投資家に適したリスク管理の仕組みがあります.
/*backtest
start: 2024-01-09 00:00:00
end: 2024-01-16 00:00:00
period: 10m
basePeriod: 1m
exchanges: [{"eid":"Futures_Binance","currency":"BTC_USDT"}]
*/

//@version=5
strategy("Improved SuperTrend Strategy with Stochastic RSI", shorttitle="IST+StochRSI", overlay=true)

// Input parameters
atr_length = input(14, title="ATR Length")
atr_multiplier = input(1.5, title="ATR Multiplier")
filter_length = input(5, title="Filter Length")
stoch_length = input(14, title="Stochastic RSI Length")
smooth_k = input(3, title="Stochastic RSI %K Smoothing")

// Calculate True Range (TR) and Average True Range (ATR)
tr = ta.rma(ta.tr, atr_length)
atr = ta.rma(tr, atr_length)

// Calculate SuperTrend
upper_band = ta.sma(close, atr_length) + atr_multiplier * atr
lower_band = ta.sma(close, atr_length) - atr_multiplier * atr

is_uptrend = close > lower_band
is_downtrend = close < upper_band

super_trend = is_uptrend ? lower_band : na
super_trend := is_downtrend ? upper_band : super_trend

// Filter for reducing false signals
filtered_super_trend = ta.sma(super_trend, filter_length)

// Calculate Stochastic RSI
rsi_value = ta.rsi(close, stoch_length)
stoch_rsi = ta.sma(ta.stoch(rsi_value, rsi_value, rsi_value, stoch_length), smooth_k)

// Entry conditions
long_condition = ta.crossover(close, filtered_super_trend) and is_uptrend and stoch_rsi < 80
short_condition = ta.crossunder(close, filtered_super_trend) and is_downtrend and stoch_rsi > 20

// Exit conditions
exit_long_condition = ta.crossunder(close, filtered_super_trend) and is_uptrend
exit_short_condition = ta.crossover(close, filtered_super_trend) and is_downtrend

// Plot SuperTrend and filtered SuperTrend
plot(super_trend, color=color.orange, title="SuperTrend", linewidth=2)
plot(filtered_super_trend, color=color.blue, title="Filtered SuperTrend", linewidth=2)

// Plot Buy and Sell signals
plotshape(series=long_condition, title="Buy Signal", color=color.green, style=shape.triangleup, location=location.belowbar)
plotshape(series=short_condition, title="Sell Signal", color=color.red, style=shape.triangledown, location=location.abovebar)

// Output signals to the console for analysis
plotchar(long_condition, "Long Signal", "▲", location.belowbar, color=color.green, size=size.small)
plotchar(short_condition, "Short Signal", "▼", location.abovebar, color=color.red, size=size.small)

// Strategy entry and exit
strategy.entry("Long", strategy.long, when=long_condition)
strategy.entry("Short", strategy.short, when=short_condition)
strategy.close("Long", when=exit_long_condition)
strategy.close("Short", when=exit_short_condition)