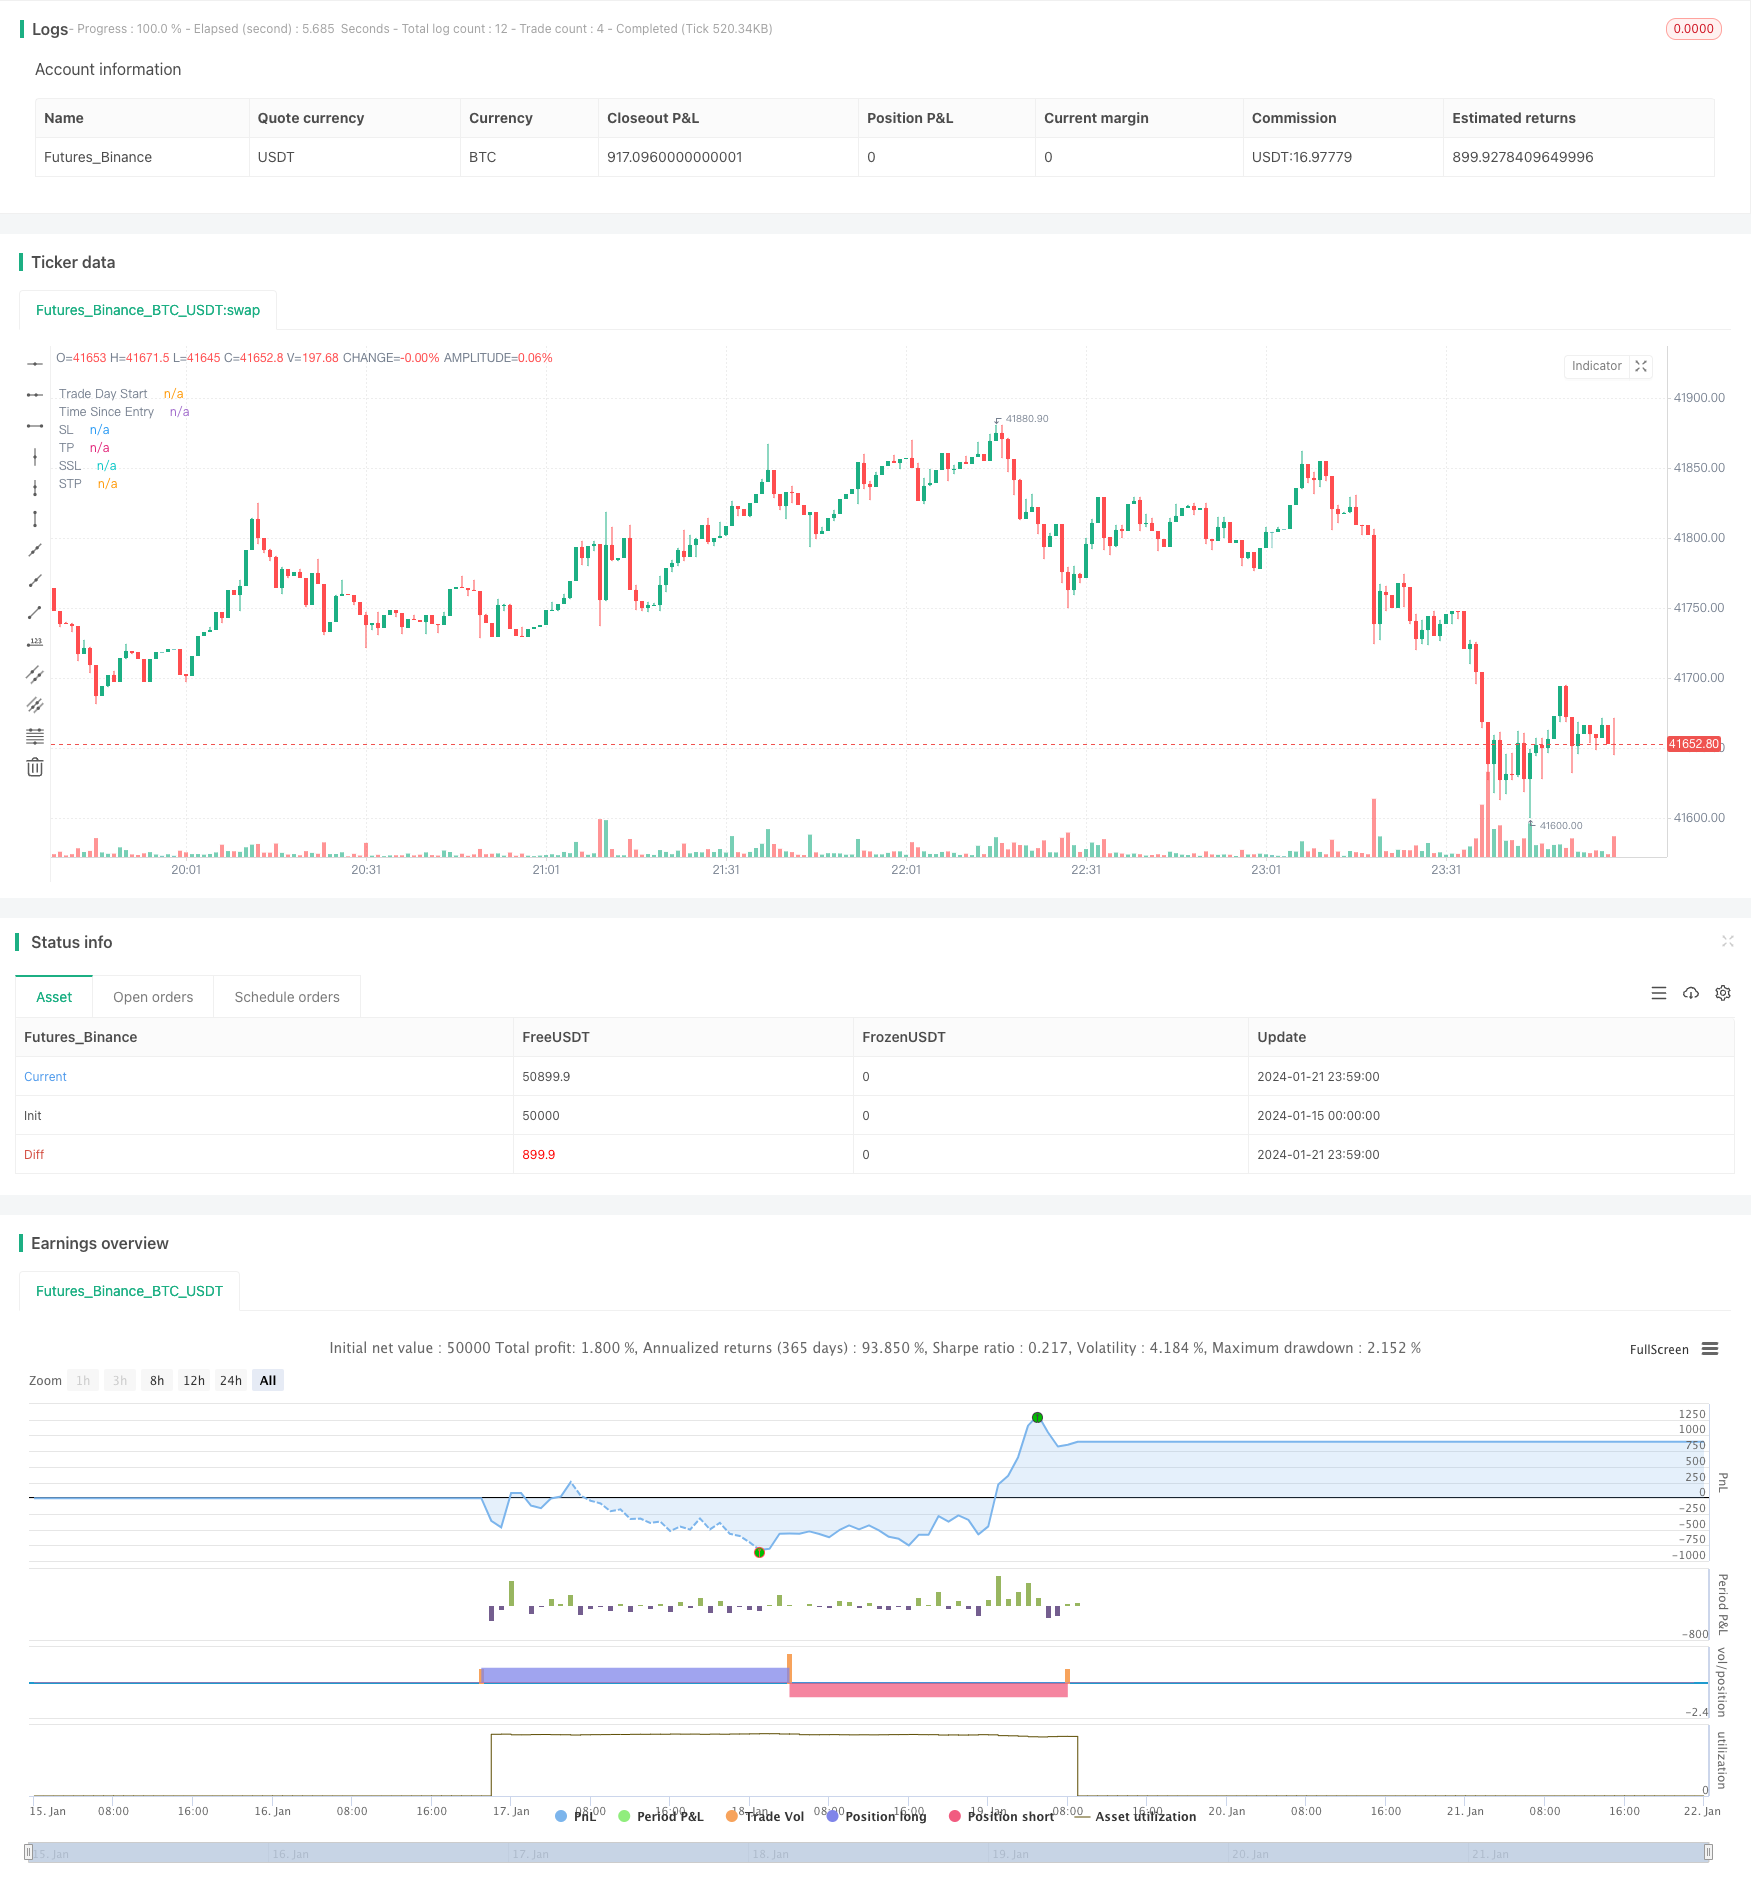
時間と空間を旅するマーフィー指標戦略

概要
これは,モフィー指標を利用して市場における大きなのを識別する簡単な量化策である.これは,5分間の時間枠で適用され,主に暗号通貨の取引に使用される.
戦略原則
この戦略は,長さ3のモフィー指標を使用し,超買線を100に設定し,超売り線を0に設定する.この戦略は,モフィー指標が超買値に達するのを待って,市場には大きな魚のが存在することを示している.その日の前の2つのモフィー指標の超買点,価格がまだ上昇を維持できれば,これは多頭入場信号である.
モフィー指数=100で,下根K線が大陽線であるとき,多入場する.止損線は,その取引日の最低点として設定され,入場後60分以内に止まる.
空調については,鏡像ロジックを使用することができる。すなわち,モフィ指数が超売りに達し,下根K線が大陰線であるとき,空調入場を行う。
戦略的優位性
モーフィー指標は,市場における大魚の蓄積の可能性のある株の行動を効果的に識別し,このような株は上昇し続ける可能性がある.
K線実体識別の強度の突破点を利用して,多くの偽突破をフィルターすることができる.
SMAフィルターと組み合わせると,トレンドが下がっている株を買うのを避けるため,取引リスクを効果的に減らすことができます.
60分間のストップは,1日間の超短線操作法を使用して,利益を迅速にロックし,撤回の可能性を低下させる.
戦略リスク
モーフィー指標は偽信号を生じ,不必要な損失を招く可能性がある。パラメータを適切に調整したり,他の指標を追加してフィルタリングすることができる。
60分超ショートライン操作 METHOD 過剰に激進し,波動率が高い株には適さない. 停止時間を適切に調整するか,移動ストップを活用して最適化することができる.
大規模なマクロ経済イベントが発生した場合に伴う市場衝撃のリスクを考慮していない. この場合は,戦略を一時停止し,市場が安定するまで取引を継続する.
戦略最適化の方向性
異なるパラメータの組み合わせをテストすることができます.例えば,モフィー指標の長さを調整し,SMA周期パラメータを最適化します.
BOLLチャネル,KD指標など,他の指標を組み合わせて,信号の正確性を向上させられるかどうかを試す.
ストップ・ロスの幅を適正に緩めることで,単一利益がより大きくなるかどうかをテストする.
この戦略の枠組みに基づいて,他の周期,例えば15分または30分版のバージョンを開発してみてください.
要約する
この戦略は全体的に非常に簡潔で分かりやすいもので,基本的考え方はクラシックなトラッキングを大のの考え方に一致している.モフィー指標の超買超売の重要なポイントを識別し,K線実体フィルタリングと連携して,多くのノイズをフィルターすることができる.SMAフィルターの追加も,戦略の安定性をさらに高めている.
60分超短線作戦は,迅速な利益をもたらすが,高い作戦リスクも伴う.全体として,これは非常に実戦価値のある量化戦略模板であり,深入な研究と最適化の価値があり,また,私たちにとって貴重な戦略開発のアイデアを提供している.
/*backtest
start: 2024-01-15 00:00:00
end: 2024-01-22 00:00:00
period: 1m
basePeriod: 1m
exchanges: [{"eid":"Futures_Binance","currency":"BTC_USDT"}]
*/

// This source code is subject to the terms of the Mozilla Public License 2.0 at https://mozilla.org/MPL/2.0/

// From "Crypto Day Trading Strategy" PDF file.

// * I'm using a SMA filter to avoid buying when the price is declining. Time frame was better at 15 min according to my test.

// 1 - Apply the 3 period Money Flow Index indicator to the 5 minute chart, using 0 and 100 as our oversold and overbought boundaries
// 2 - Wait for the MFI to reach overbought levels, that indicates the presence of "big sharks" in the market. Price needs to hold up
// the first two MFI overbought occurrences of the day to be considered as a bullish entry signal.*
// 3 - We buy when the MFI = 100 and the next candle is a bullish candle with short wicks.
// 4 - We place our Stop Loss below the low of the trading day and we Take Profit during the first 60 minutes after taking the trade.

// The logic above can be used in a mirrored fashion to take short entries, this is a custom parameter that can be modified from
// the strategy Inputs panel.

// © tweakerID

//@version=4
strategy("Money Flow Index 5 min Strategy",
     overlay=true )

direction = input(0, title = "Strategy Direction", type=input.integer, minval=-1, maxval=1)
strategy.risk.allow_entry_in(direction == 0 ? strategy.direction.all : (direction < 0 ? strategy.direction.short : strategy.direction.long))

/////////////////////// STRATEGY INPUTS ////////////////////////////////////////
title1=input(true, "-----------------Strategy Inputs-------------------")

i_MFI = input(3, title="MFI Length")
OB=input(100, title="Overbought Level")
OS=input(0, title="Oversold Level")
barsizeThreshold=input(.5, step=.05, minval=.1, maxval=1, title="Bar Body Size, 1=No Wicks")
i_MAFilter = input(true, title="Use MA Trend Filter")
i_MALen = input(80, title="MA Length")
i_timedexit=input(false, title="Use 60 minutes exit rule")
short=input(true, title="Use Mirrored logic for Shorts")

/////////////////////// BACKTESTER /////////////////////////////////////////////
title2=input(true, "-----------------General Inputs-------------------")

// Backtester General Inputs
i_SL=input(true, title="Use Stop Loss and Take Profit")
i_SLType=input(defval="Strategy Stop", title="Type Of Stop", options=["Strategy Stop", "Swing Lo/Hi", "ATR Stop"])
i_SPL=input(defval=10, title="Swing Point Lookback")
i_PercIncrement=input(defval=3, step=.1, title="Swing Point SL Perc Increment")*0.01
i_ATR = input(14, title="ATR Length")
i_ATRMult = input(5, step=.1, title="ATR Multiple")
i_TPRRR = input(2.2, step=.1, title="Take Profit Risk Reward Ratio")
TS=input(false, title="Trailing Stop")

// Bought and Sold Boolean Signal
bought = strategy.position_size > strategy.position_size[1]
 or strategy.position_size < strategy.position_size[1]

// Price Action Stop and Take Profit
LL=(lowest(i_SPL))*(1-i_PercIncrement)
HH=(highest(i_SPL))*(1+i_PercIncrement)
LL_price = valuewhen(bought, LL, 0)
HH_price = valuewhen(bought, HH, 0)
entry_LL_price = strategy.position_size > 0 ? LL_price : na
entry_HH_price = strategy.position_size < 0 ? HH_price : na
tp=strategy.position_avg_price + (strategy.position_avg_price - entry_LL_price)*i_TPRRR
stp=strategy.position_avg_price - (entry_HH_price - strategy.position_avg_price)*i_TPRRR

// ATR Stop
ATR=atr(i_ATR)*i_ATRMult
ATRLong = ohlc4 - ATR
ATRShort = ohlc4 + ATR
ATRLongStop = valuewhen(bought, ATRLong, 0)
ATRShortStop = valuewhen(bought, ATRShort, 0)
LongSL_ATR_price = strategy.position_size > 0 ? ATRLongStop : na
ShortSL_ATR_price = strategy.position_size < 0 ? ATRShortStop : na
ATRtp=strategy.position_avg_price + (strategy.position_avg_price - LongSL_ATR_price)*i_TPRRR
ATRstp=strategy.position_avg_price - (ShortSL_ATR_price - strategy.position_avg_price)*i_TPRRR


// Strategy Stop
DayStart = time == timestamp("UTC", year, month, dayofmonth, 0, 0, 0)
plot(DayStart ? 1e9 : na, style=plot.style_columns, color=color.silver, transp=80, title="Trade Day Start")
float LongStop = valuewhen(DayStart,low,0)*(1-i_PercIncrement)
float ShortStop = valuewhen(DayStart,high,0)*(1+i_PercIncrement)
float StratTP = strategy.position_avg_price + (strategy.position_avg_price - LongStop)*i_TPRRR
float StratSTP = strategy.position_avg_price - (ShortStop - strategy.position_avg_price)*i_TPRRR

/////////////////////// STRATEGY LOGIC /////////////////////////////////////////

MFI=mfi(close,i_MFI)
barsize=high-low
barbodysize=close>open?(open-close)*-1:(open-close)
shortwicksbar=barbodysize>barsize*barsizeThreshold
SMA=sma(close, i_MALen)
MAFilter=close > SMA
timesinceentry=(time - valuewhen(bought, time, 0)) / 60000
timedexit=timesinceentry == 60

BUY = MFI[1] == OB and close > open and shortwicksbar and (i_MAFilter ? MAFilter : true)
bool SELL = na
if short
    SELL := MFI[1] == OS and close < open and shortwicksbar and (i_MAFilter ? not MAFilter : true)

//Debugging Plots
plot(timesinceentry, transp=100, title="Time Since Entry")

//Trading Inputs
DPR=input(true, "Allow Direct Position Reverse")
reverse=input(false, "Reverse Trades")

// Entries
if reverse
    if not DPR
        strategy.entry("long", strategy.long, when=SELL and strategy.position_size == 0)
        strategy.entry("short", strategy.short, when=BUY and strategy.position_size == 0)
    else
        strategy.entry("long", strategy.long, when=SELL)
        strategy.entry("short", strategy.short, when=BUY)
else
    if not DPR
        strategy.entry("long", strategy.long, when=BUY and strategy.position_size == 0)
        strategy.entry("short", strategy.short, when=SELL and strategy.position_size == 0)
    else
        strategy.entry("long", strategy.long, when=BUY)
        strategy.entry("short", strategy.short, when=SELL)
if i_timedexit
    strategy.close_all(when=timedexit)

SL= i_SLType == "Swing Lo/Hi" ? entry_LL_price : i_SLType == "ATR Stop" ? LongSL_ATR_price : LongStop
SSL= i_SLType == "Swing Lo/Hi" ? entry_HH_price : i_SLType == "ATR Stop" ? ShortSL_ATR_price : ShortStop
TP= i_SLType == "Swing Lo/Hi" ? tp : i_SLType == "ATR Stop" ? ATRtp : StratTP
STP= i_SLType == "Swing Lo/Hi" ? stp : i_SLType == "ATR Stop" ? ATRstp : StratSTP

//TrailingStop
dif=(valuewhen(strategy.position_size>0 and strategy.position_size[1]<=0, high,0))
 -strategy.position_avg_price
trailOffset     = strategy.position_avg_price - SL
var tstop = float(na)
if strategy.position_size > 0
    tstop := high- trailOffset - dif
    if tstop<tstop[1]
        tstop:=tstop[1]
else
    tstop := na
StrailOffset     = SSL - strategy.position_avg_price
var Ststop = float(na)
Sdif=strategy.position_avg_price-(valuewhen(strategy.position_size<0
 and strategy.position_size[1]>=0, low,0))
if strategy.position_size < 0
    Ststop := low+ StrailOffset + Sdif
    if Ststop>Ststop[1]
        Ststop:=Ststop[1]
else
    Ststop := na

strategy.exit("TP & SL", "long", limit=TP, stop=TS? tstop : SL, when=i_SL)
strategy.exit("TP & SL", "short", limit=STP, stop=TS? Ststop : SSL, when=i_SL)

/////////////////////// PLOTS //////////////////////////////////////////////////

plot(i_SL and strategy.position_size > 0 and not TS ? SL : i_SL and strategy.position_size > 0 and TS ? tstop : na , title='SL', style=plot.style_cross, color=color.red)
plot(i_SL and strategy.position_size < 0 and not TS ? SSL : i_SL and strategy.position_size < 0 and TS ? Ststop : na , title='SSL', style=plot.style_cross, color=color.red)
plot(i_SL and strategy.position_size > 0 ? TP : na, title='TP', style=plot.style_cross, color=color.green)
plot(i_SL and strategy.position_size < 0 ? STP : na, title='STP', style=plot.style_cross, color=color.green)
// Draw price action setup arrows
plotshape(BUY ? 1 : na, style=shape.triangleup, location=location.belowbar,
 color=color.green, title="Bullish Setup", size=size.auto)
plotshape(SELL ? 1 : na, style=shape.triangledown, location=location.abovebar,
 color=color.red, title="Bearish Setup", size=size.auto)