移動平均とサイクル判断に基づくモメンタムブレイクスルー戦略
概要
この戦略は,異なる周期のEMA平均線を計算して,現在の市場がどの周期段階にあるかを判断し,ATRと組み合わせて突破判断を行い,高い確率のトレンド追跡取引を実現する.
戦略原則
- 5日線,20日線,40日線3本のEMA平均線を計算する
- 3つの平均線の大きさの関係を比較して,現在6つの異なる周期の1つにあることを判断します.
- 5日線>20日線>40日線は第1サイクルです.
- 20日線>5日線>40日線は第2周期です. ……
- 周期が決定された後,ATR指標を計算し,ATR倍数を突破基準として設定します.
- 価格が前 BAR の ATR トレーリングストップを超えると買取シグナルが生成されます.
- 価格が1BARのATRトレーリングストップを下回ったときにセールシグナルが作られます.
- この組み合わせによって,高確率のトレンド追跡取引が可能になります.
戦略的優位性
- 周期判断は信号の信頼性を高める
異なるEMA平均線の大きさの関係を判断することで,市場の現在の周期的段階を効果的に判断し,不適切な周期で誤信号を生じさせないようにすることができる.
- ATRは偽信号を検知する
ATR指標は市場の波動性を効果的に表現し,一定数のATRを突破基準として設定し,多くの偽の突破信号をフィルターすることができます.
- ポートフォリオ判断は高確率の取引機会を形成する
周期判断とATR突破判断の有機的組み合わせにより,信号の発生確率が大幅に上昇し,その結果,取引の収益率も上昇した.
戦略リスク
- パラメータの最適化が難しい
策略には複数のパラメータが含まれているため,最適化が難しく,パラメータの不適切な設定は,策略のパフォーマンスに影響を与える可能性があります.
- 遅滞している.
市場が急速に変化する時には,EMA平均線とATR指標は,誤ったシグナルまたは見逃したチャンスを生み出す可能性がある.
- 厳格な停止が必要
どんな技術指標でも誤信号の発生を完全に回避することは困難であり,リスクを制御するために厳格な止損を設定する必要があります.
戦略最適化の方向性
- パラメータをさらに最適化
より豊富な歴史データを使ってパラメータを最適化し,最適なパラメータの組み合わせを見つけます.
- 適応力を高めること
市場変動に応じてATRパラメータを自動的に調整し,戦略の自主性を向上させる可能性が考慮される.
- 他の指標と組み合わせると
波動率,交差量などの他の指標と組み合わせて判断を補助し,信号品質を向上させることができます.
要約する
この戦略は,EMA平均線判断周期とATR指標によって動量突破基準を設定し,高確率のトレンド追跡取引を実現する.判断周期,フィルター偽信号,信号品質の向上などの利点がある.しかし,パラメータの最適化が困難で,滞りがあるなどのリスクもある.さらにパラメータの最適化,自己適応力の向上などが必要である.
/*backtest
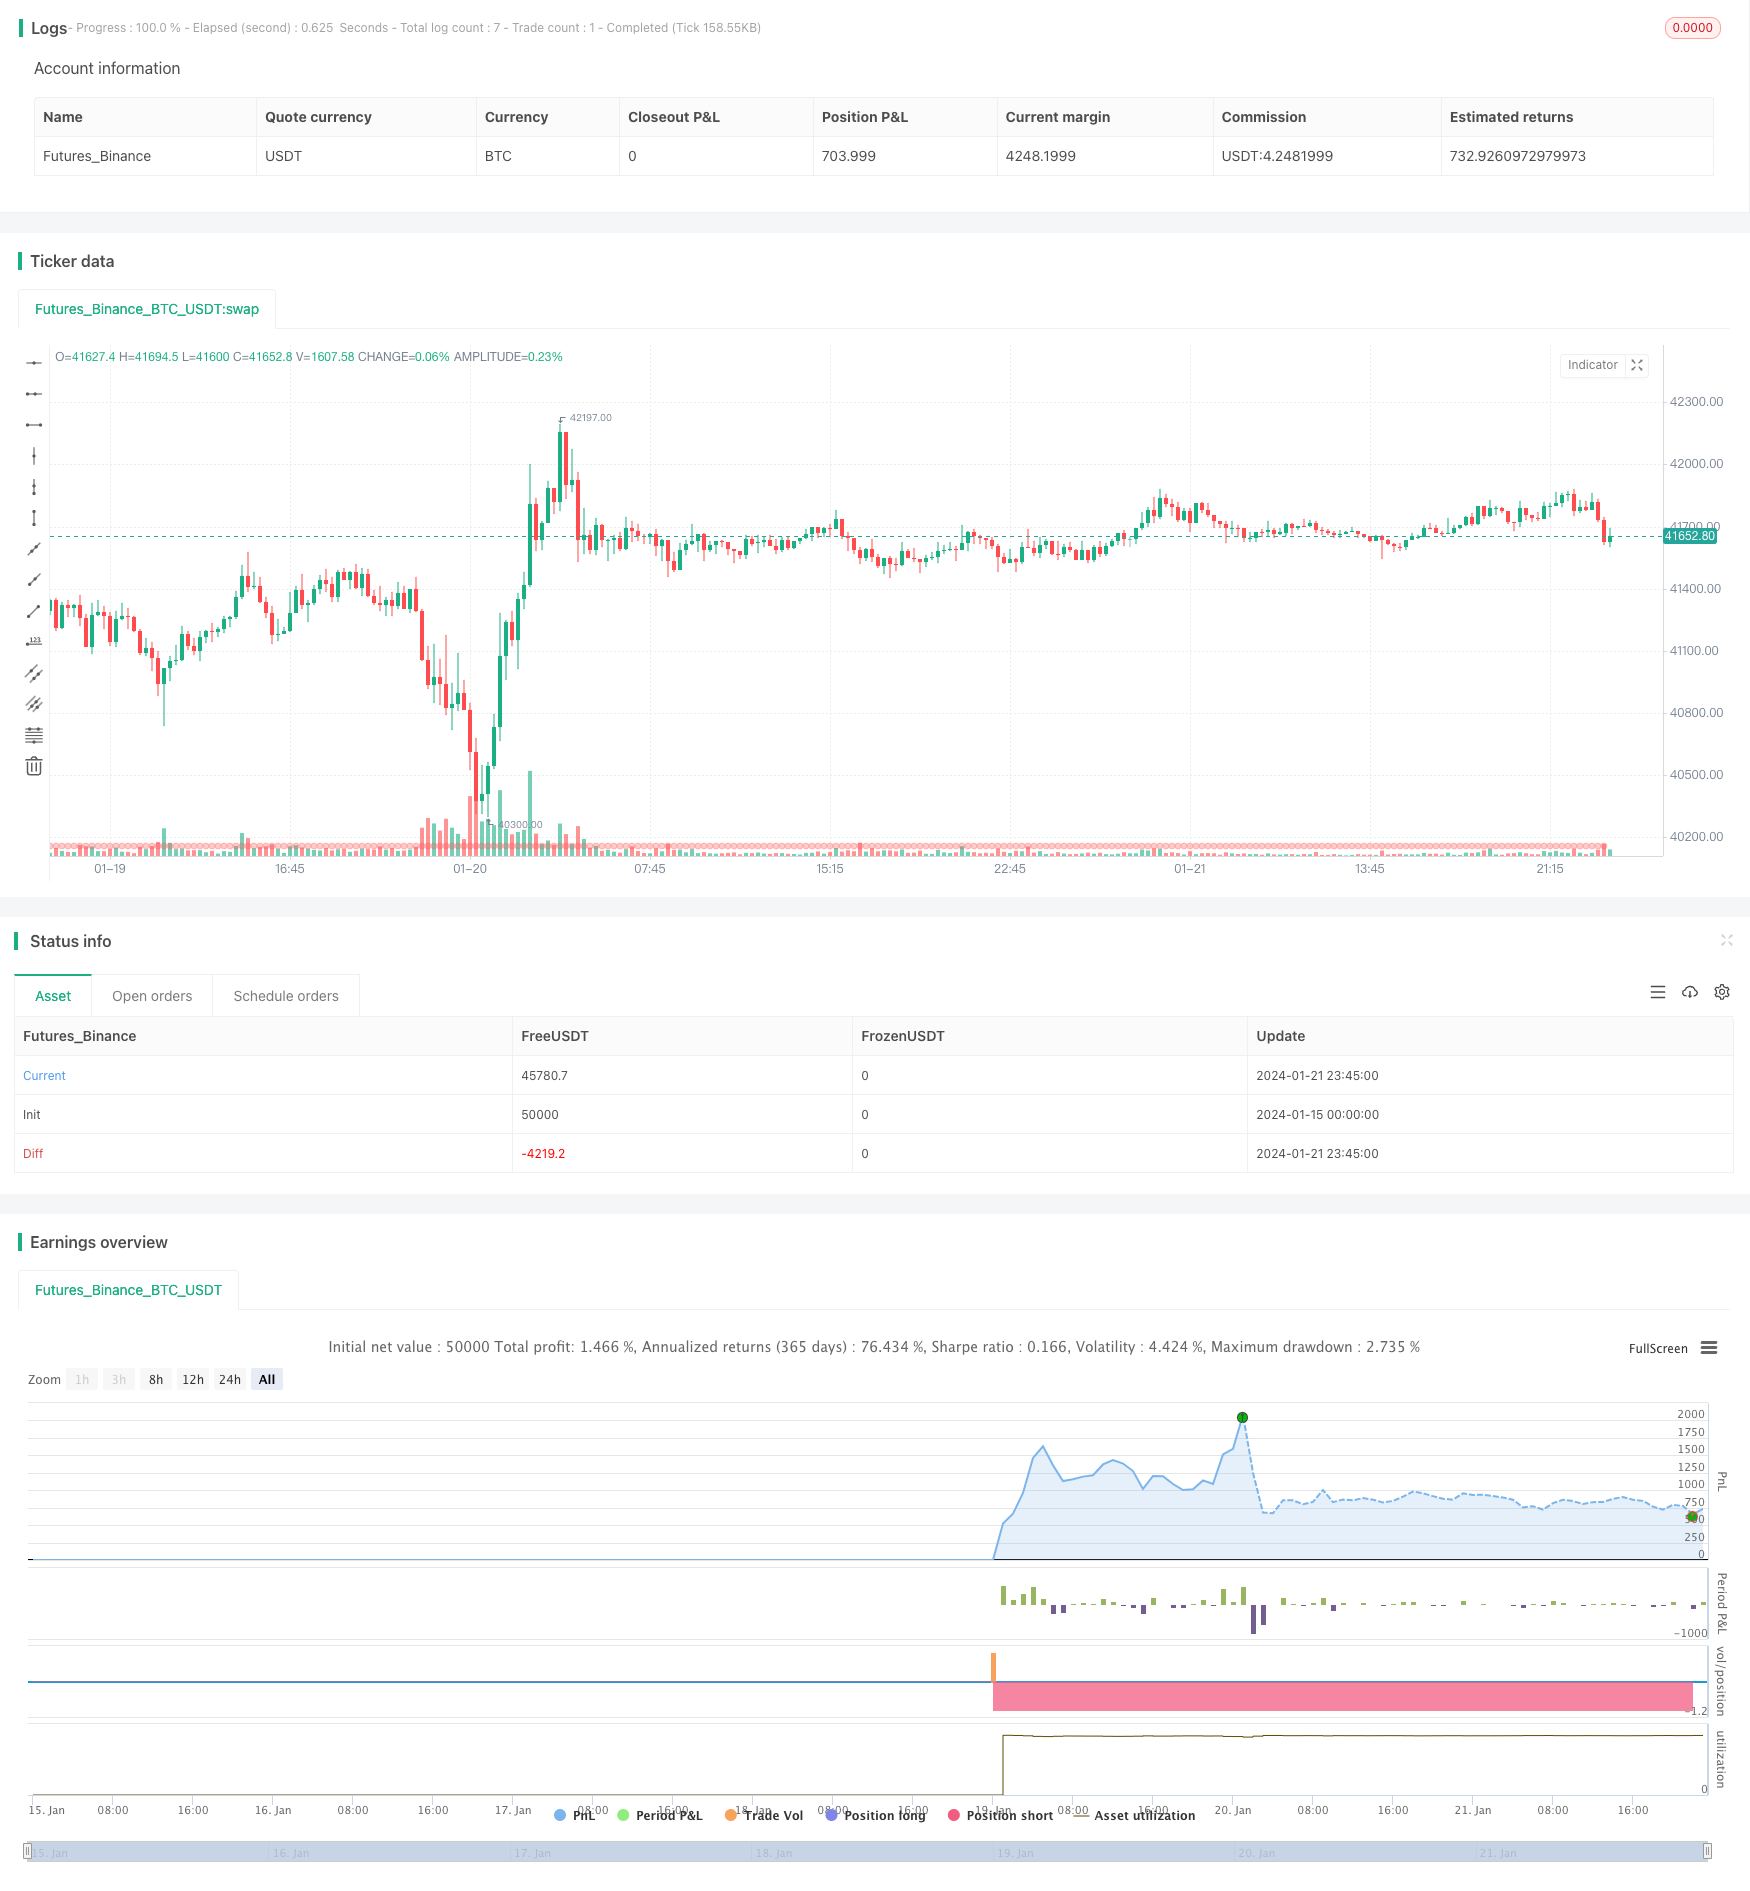
start: 2024-01-15 00:00:00
end: 2024-01-22 00:00:00
period: 15m
basePeriod: 5m
exchanges: [{"eid":"Futures_Binance","currency":"BTC_USDT"}]
*/
// This source code is subject to the terms of the Mozilla Public License 2.0 at https://mozilla.org/MPL/2.0/
// © kgynofomo
//@version=5
strategy(title="[Salavi] | Andy Advance Pro Strategy",overlay = true)
ema_short = ta.ema(close,5)
ema_middle = ta.ema(close,20)
ema_long = ta.ema(close,40)
cycle_1 = ema_short>ema_middle and ema_middle>ema_long
cycle_2 = ema_middle>ema_short and ema_short>ema_long
cycle_3 = ema_middle>ema_long and ema_long>ema_short
cycle_4 = ema_long>ema_middle and ema_middle>ema_short
cycle_5 = ema_long>ema_short and ema_short>ema_middle
cycle_6 = ema_short>ema_long and ema_long>ema_middle
bull_cycle = cycle_1 or cycle_2 or cycle_3
bear_cycle = cycle_4 or cycle_5 or cycle_6
// label.new("cycle_1")
// bgcolor(color=cycle_1?color.rgb(82, 255, 148, 60):na)
// bgcolor(color=cycle_2?color.rgb(82, 255, 148, 70):na)
// bgcolor(color=cycle_3?color.rgb(82, 255, 148, 80):na)
// bgcolor(color=cycle_4?color.rgb(255, 82, 82, 80):na)
// bgcolor(color=cycle_5?color.rgb(255, 82, 82, 70):na)
// bgcolor(color=cycle_6?color.rgb(255, 82, 82, 60):na)
// Inputs
a = input(2, title='Key Vaule. \'This changes the sensitivity\'')
c = input(7, title='ATR Period')
h = false
xATR = ta.atr(c)
nLoss = a * xATR
src = h ? request.security(ticker.heikinashi(syminfo.tickerid), timeframe.period, close, lookahead=barmerge.lookahead_off) : close
xATRTrailingStop = 0.0
iff_1 = src > nz(xATRTrailingStop[1], 0) ? src - nLoss : src + nLoss
iff_2 = src < nz(xATRTrailingStop[1], 0) and src[1] < nz(xATRTrailingStop[1], 0) ? math.min(nz(xATRTrailingStop[1]), src + nLoss) : iff_1
xATRTrailingStop := src > nz(xATRTrailingStop[1], 0) and src[1] > nz(xATRTrailingStop[1], 0) ? math.max(nz(xATRTrailingStop[1]), src - nLoss) : iff_2
pos = 0
iff_3 = src[1] > nz(xATRTrailingStop[1], 0) and src < nz(xATRTrailingStop[1], 0) ? -1 : nz(pos[1], 0)
pos := src[1] < nz(xATRTrailingStop[1], 0) and src > nz(xATRTrailingStop[1], 0) ? 1 : iff_3
xcolor = pos == -1 ? color.red : pos == 1 ? color.green : color.blue
ema = ta.ema(src, 1)
above = ta.crossover(ema, xATRTrailingStop)
below = ta.crossover(xATRTrailingStop, ema)
buy = src > xATRTrailingStop and above
sell = src < xATRTrailingStop and below
barbuy = src > xATRTrailingStop
barsell = src < xATRTrailingStop
atr = ta.atr(14)
atr_length = input.int(25)
atr_rsi = ta.rsi(atr,atr_length)
atr_valid = atr_rsi>50
long_condition = buy and bull_cycle and atr_valid
short_condition = sell and bear_cycle and atr_valid
Exit_long_condition = short_condition
Exit_short_condition = long_condition
if long_condition
strategy.entry("Andy Buy",strategy.long, limit=close,comment="Andy Buy Here")
if Exit_long_condition
strategy.close("Andy Buy",comment="Andy Buy Out")
// strategy.entry("Andy fandan Short",strategy.short, limit=close,comment="Andy 翻單 short Here")
// strategy.close("Andy fandan Buy",comment="Andy short Out")
if short_condition
strategy.entry("Andy Short",strategy.short, limit=close,comment="Andy short Here")
// strategy.exit("STR","Long",stop=longstoploss)
if Exit_short_condition
strategy.close("Andy Short",comment="Andy short Out")
// strategy.entry("Andy fandan Buy",strategy.long, limit=close,comment="Andy 翻單 Buy Here")
// strategy.close("Andy fandan Short",comment="Andy Buy Out")
inLongTrade = strategy.position_size > 0
inLongTradecolor = #58D68D
notInTrade = strategy.position_size == 0
inShortTrade = strategy.position_size < 0
// bgcolor(color = inLongTrade?color.rgb(76, 175, 79, 70):inShortTrade?color.rgb(255, 82, 82, 70):na)
plotshape(close!=0,location = location.bottom,color = inLongTrade?color.rgb(76, 175, 79, 70):inShortTrade?color.rgb(255, 82, 82, 70):na)
plotshape(long_condition, title='Buy', text='Andy Buy', style=shape.labelup, location=location.belowbar, color=color.new(color.green, 0), textcolor=color.new(color.white, 0), size=size.tiny)
plotshape(short_condition, title='Sell', text='Andy Sell', style=shape.labeldown, location=location.abovebar, color=color.new(color.red, 0), textcolor=color.new(color.white, 0), size=size.tiny)
//atr > close *0.01* parameter