ダイナミック プライス チャネル ストップ ロス トレーリング戦略
概要
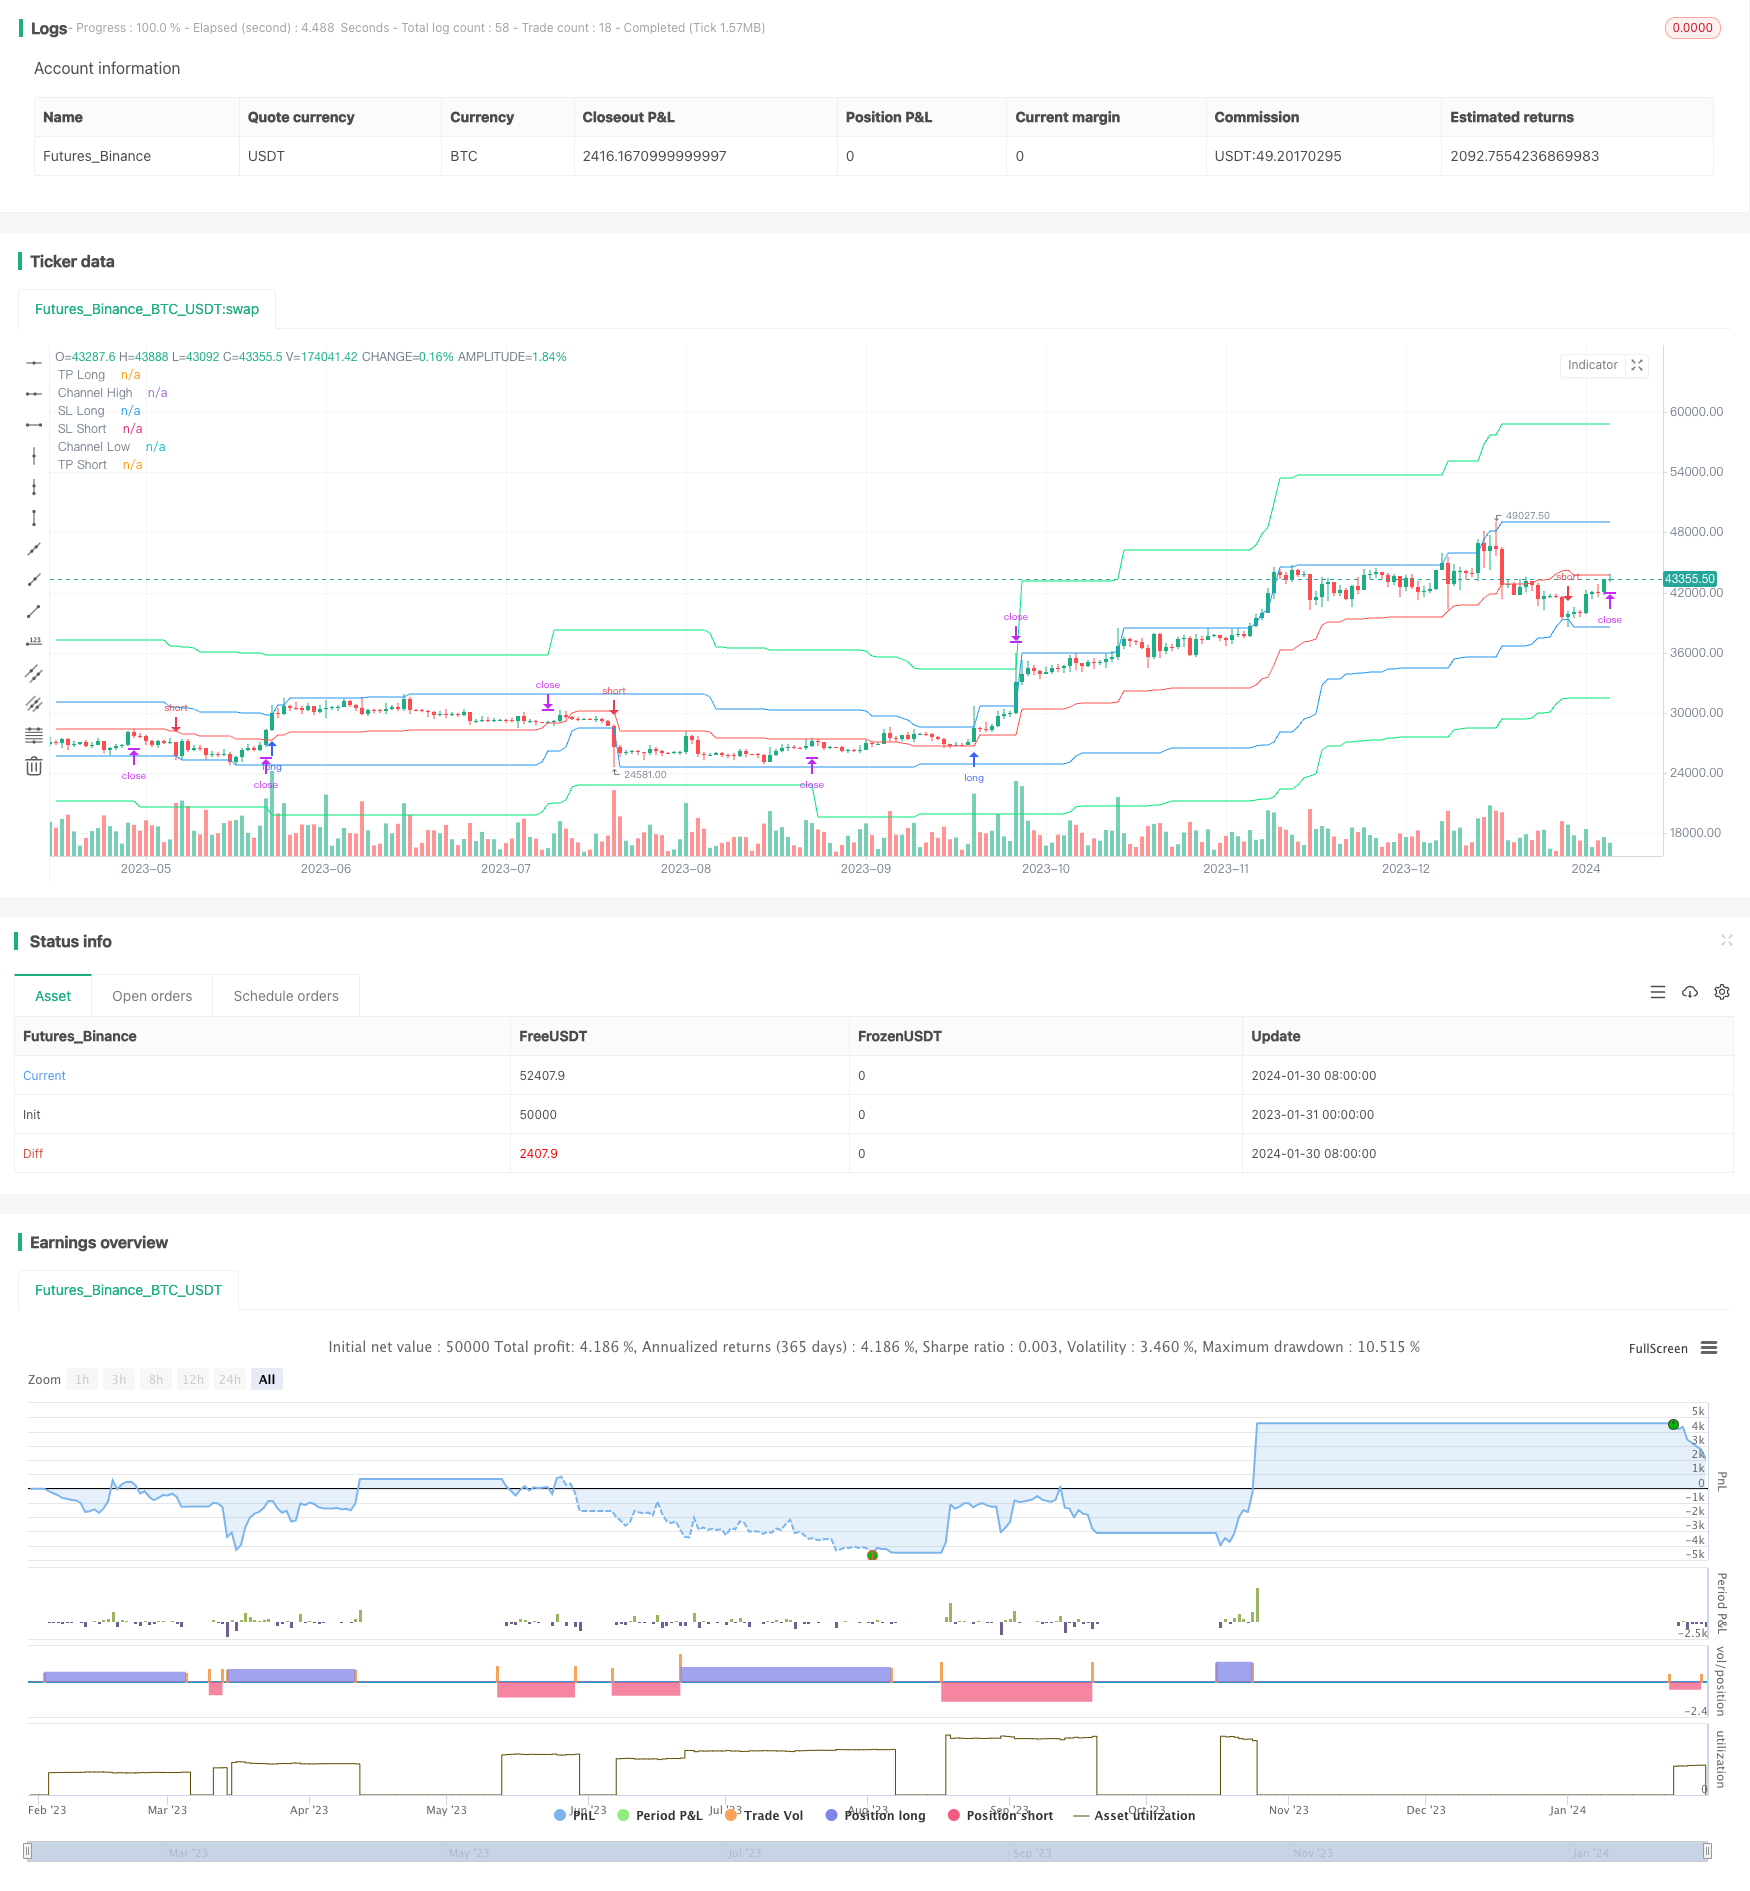
この戦略は,Donchian Price Channel指標に基づいて開発された.この指標は,一定の周期内の最高価格と最低価格を計算することによって,価格チャネルを形成する.戦略は,価格チャネルを利用して,双方向取引を実現し,止損とストップ価格を設定する.止損価格は,価格チャネルの中線として固定され,ストップ価格は,価格チャネル上下限の外にある一定パーセントとして設定される.戦略は,止まりとストップの追跡も実現する.
戦略原則
まず,戦略は,pclenのパラメータに基づいて価格チャネルの上限hと下限lを計算します. 中線センターは,価格チャネルの上下限の平均値です. それから,長ポジションと空ポジションのストップパラメータtpに基づいて,ストップ価格tplとtpsを計算します. ストップ価格は,価格チャネルの中線センターに固定されています.
取引の論理は以下の通りです.
多ポジション開設シグナル:通路上限hより高い価格で通路内に戻った時に多ポジション開設 多ポジション平仓シグナル:価格が通路中線center ((ストップ) よりも低い場合,またはストップ価格tpl ((ストップ) よりも高い場合,多ポジション平仓
空仓開仓シグナル:通路下限lより低い価格で通路内に戻った空仓開仓 空仓平仓シグナル:通路中線center ((ストップ) よりも高い価格またはストップ価格tps ((ストップ)) よりも低い価格で空仓平仓
優位分析
この戦略は以下の利点があります.
- 価格の逆転を捉えるための二次取引
- 価格チャネルを使ってトレンドの方向を判断し,偽突破を避ける
- ストップ・ロスを設定し,リスクを制御する
- ポジション規模を計算し,リスクの大きさを計算し,リスクを制御します.
- ストップとストップ・ロスのトラッキングにより,より多くの利益が確保できます.
リスク分析
この戦略にはいくつかのリスクがあります.
- 価格チャネルパラメータの不適切な設定により,取引頻度が高くなり,取引機会が逃れることがあります.
- ストップ・ロズ・価格の過度な許容はリスクの穴を拡大する可能性がある.
- 追跡停止は高波動期に早期に発動する可能性があります.
これらのリスクは,パラメータの調整と人工モニタリングによって軽減・制御できます.
最適化の方向
この戦略は,以下の点で改善できます.
- 金融危機の状況で頻繁に空調を避けるために,より多くの指標をフィルターする.
- ATR ストップなど,様々なストップ・ストップ・損失アルゴリズムをテストできます.
- 拡張されたクロスタイムサイクル取引システムで,より高度なタイムサイクルを利用してトレンド方向を決定する
- ポジション管理モジュールを追加し,資金使用率に応じてポジションを調整する
- 価格突破の成功率を判断し,偽突破を避けるために,機械学習モデルを組み合わせる
要約する
この戦略は,全体として,価格チャネル指標を利用して双方向取引を実現する効果的な方法である. ストップ・ストップ・損失とポジションコントロールモジュールが設定され,リスクをうまく制御することができる. 特定の最適化と調整によって,強力な量化取引戦略になることができる.
/*backtest
start: 2023-01-31 00:00:00
end: 2024-01-31 00:00:00
period: 1d
basePeriod: 1h
exchanges: [{"eid":"Futures_Binance","currency":"BTC_USDT"}]
*/

//Noro
//2020

//@version=4
strategy(title = "Noro's RiskDonchian Strategy", shorttitle = "RiskDonchian str", overlay = true, default_qty_type = strategy.percent_of_equity, initial_capital = 100, default_qty_value = 100, commission_value = 0.1)

//Settings
needlong = input(true, defval = true, title = "Long")
needshort = input(true, defval = true, title = "Short")
tp = input(defval = 20.0, minval = 1, title = "Take-profit, %")
tptype = input(defval = "2. Fix", options = ["1. None", "2. Fix", "3. Trailing"], title = "Take-profit type")
sltype = input(defval = "2. Center", options = ["1. None", "2. Center"], title = "Take-profit type")
risklong  = input(5.0, minval = 0.0, maxval = 99.9, title = "Risk size for long, %")
riskshort = input(5.0, minval = 0.0, maxval = 99.9, title = "Risk size for short, %")
pclen = input(50, minval = 1, title = "Price Channel Length")
showll = input(true, defval = true, title = "Show lines")
showbg = input(false, defval = false, title = "Show Background")
showof = input(true, defval = true, title = "Show Offset")
showlabel = input(true, defval = true, title = "Show label")
fromyear = input(1900, defval = 1900, minval = 1900, maxval = 2100, title = "From Year")
toyear = input(2100, defval = 2100, minval = 1900, maxval = 2100, title = "To Year")
frommonth = input(01, defval = 01, minval = 01, maxval = 12, title = "From Month")
tomonth = input(12, defval = 12, minval = 01, maxval = 12, title = "To Month")
fromday = input(01, defval = 01, minval = 01, maxval = 31, title = "From day")
today = input(31, defval = 31, minval = 01, maxval = 31, title = "To day")

//Price Channel
h = highest(high, pclen)
l = lowest(low, pclen)
center = (h + l) / 2

//Take-profit
tpl = 0.0
tpl := tptype == "2. Fix" and strategy.position_size > 0 ? tpl[1] : h * (100 + tp) / 100

//Stop-loss
tps = 0.0
tps := tptype == "2. Fix" and strategy.position_size < 0 ? tps[1] : l * (100 - tp) / 100

//Lines
tplcol = showll and needlong and tptype != "1. None" ? color.lime : na
pclcol = showll and needlong ? color.blue : na
sllcol = showll and needlong and sltype != "1. None" ? color.red : na
tpscol = showll and needshort and tptype != "1. None" ? color.lime : na
pcscol = showll and needshort ? color.blue : na
slscol = showll and needshort and sltype != "1. None" ? color.red : na
offset = showof ? 1 : 0
plot(tpl, offset = offset, color = tplcol, title = "TP Long")
plot(h, offset = offset, color = pclcol, title = "Channel High")
plot(center, offset = offset, color = sllcol, title = "SL Long")
plot(center, offset = offset, color = slscol, title = "SL Short")
plot(l, offset = offset, color = pcscol, title = "Channel Low")
plot(tps, offset = offset, color = tpscol, title = "TP Short")

//Background
size = strategy.position_size
bgcol = showbg == false ? na : size > 0 ? color.lime : size < 0 ? color.red : na
bgcolor(bgcol, transp = 70)

//Lot size
risksizelong = -1 * risklong
risklonga = ((center / h) - 1) * 100
coeflong = abs(risksizelong / risklonga)
lotlong = (strategy.equity / close) * coeflong
risksizeshort = -1 * riskshort
riskshorta = ((center / l) - 1) * 100
coefshort = abs(risksizeshort / riskshorta)
lotshort = (strategy.equity / close) * coefshort

//Trading
truetime = time > timestamp(fromyear, frommonth, fromday, 00, 00) and time < timestamp(toyear, tomonth, today, 23, 59)
mo = 0
mo := strategy.position_size != 0 ? 0 : high >= center[1] and low <= center[1] ? 1 : mo[1]

if h > 0
    longlimit = tptype == "1. None" ? na : tpl
    longstop = sltype == "1. None" ? na : center
    strategy.entry("Long", strategy.long, lotlong, stop = h, when = strategy.position_size <= 0 and needlong and truetime and mo)
    strategy.exit("TP Long", "Long", limit = longlimit, stop = longstop)
    shortlimit = tptype == "1. None" ? na : tps
    shortstop = sltype == "1. None" ? na : center
    strategy.entry("Short", strategy.short, lotshort, stop = l, when = strategy.position_size >= 0 and needshort and truetime and mo)
    strategy.exit("Exit Short", "Short", limit = shortlimit, stop = shortstop)
if time > timestamp(toyear, tomonth, today, 23, 59)
    strategy.close_all()
    strategy.cancel("Long")
    strategy.cancel("Short")

if showlabel

    //Drawdown
    max = 0.0
    max := max(strategy.equity, nz(max[1]))
    dd = (strategy.equity / max - 1) * 100
    min = 100.0
    min := min(dd, nz(min[1]))

    //Label
    min := round(min * 100) / 100
    labeltext = "Drawdown: " + tostring(min) + "%"
    var label la = na
    label.delete(la)
    tc = min > -100 ? color.white : color.red
    osx = timenow + round(change(time)*10)
    osy = highest(100)