移動平均ゴールデンクロスに基づく画期的なモメンタム戦略
作成日:
2024-02-06 14:39:22
最終変更日:
2024-02-06 14:39:22
コピー:
3
クリック数:
755
1
フォロー
1751
フォロワー
概要
この戦略は,12日指数移動平均 (((EMA) と26日EMAの金叉を入場信号として使用する.偽の突破をフィルターするために,戦略は市場トレンドを判断するMACD指標を導入し,RSI指標が超買い超売り領域にあるかどうかを判断する.同時に,戦略は,価格がレジスタンスレベルを突破するかどうかを判断し,トレンドを確認する.
ストップの場合は,追跡ストップ,均線ストップ,均線叉死という3つのオプションが用意されている. ストップの場合は,2つの順序のストップターゲットが用意されている.
戦略原則
入口信号
- 12日のEMAを26日のEMAに突破し,金叉を構成する
- MACD指数は正であり,MACD線はシグナル線より高い
- RSIの値が設定された範囲内にある
- 21日のEMAと7日のSMAよりも高い閉店価格
入学確認
- 選択判断: 価格が動的抵抗点を突破する
損失を抑える方法
- トラッキングストップ:入場価格と設定されたトラッキングストップの割合に基づいてトラッキングストップを設定します.
- 平均線ストップ:終盤価格が7日SMAストップを下回った
- 平均線叉死:12日EMA下26日EMAストップを突破する
止まる方法
- 2つの順番のストップ目標を設定し,最初のストップが触発されたときに一部を販売し,第二のストップが触発されたときに全量を販売します.
戦略的優位性
- 均線システムのフィルタリングにより,誤導信号をフィルターし,入場精度を向上させる.
- 異なるタイプのトレーダーに適した複数のオプションのストップ
- ダイナミック・トラッキング・ストップ・ローズ・リスク・コントロール
- 試合をグループ化して,利益の一部をロックする.
戦略リスク
- 市場が揺れ動いたとき,EMAは偽信号を多く発生させる
- 追跡停止は突破の後に突破される可能性がある
- 平均線叉のストップは,トレンドが逆転したときにタイムストップができない
対策として
- MACD指数と組み合わせた市場の実際の動きを判断する
- トラックストロップの幅を調整する
- 任意の他の停止方法または結合停止
戦略最適化の方向性
- EMAパラメータを最適化し,最適なパラメータの組み合わせを決定する
- 異なる止損方法とパラメータをテストし,最適の止損ソリューションを見つける
- 止パラメータをテストし,止効果を最適化
- 他の指標と組み合わせた タイミングの判断
- 異なる品種,周期パラメータに応じて調整
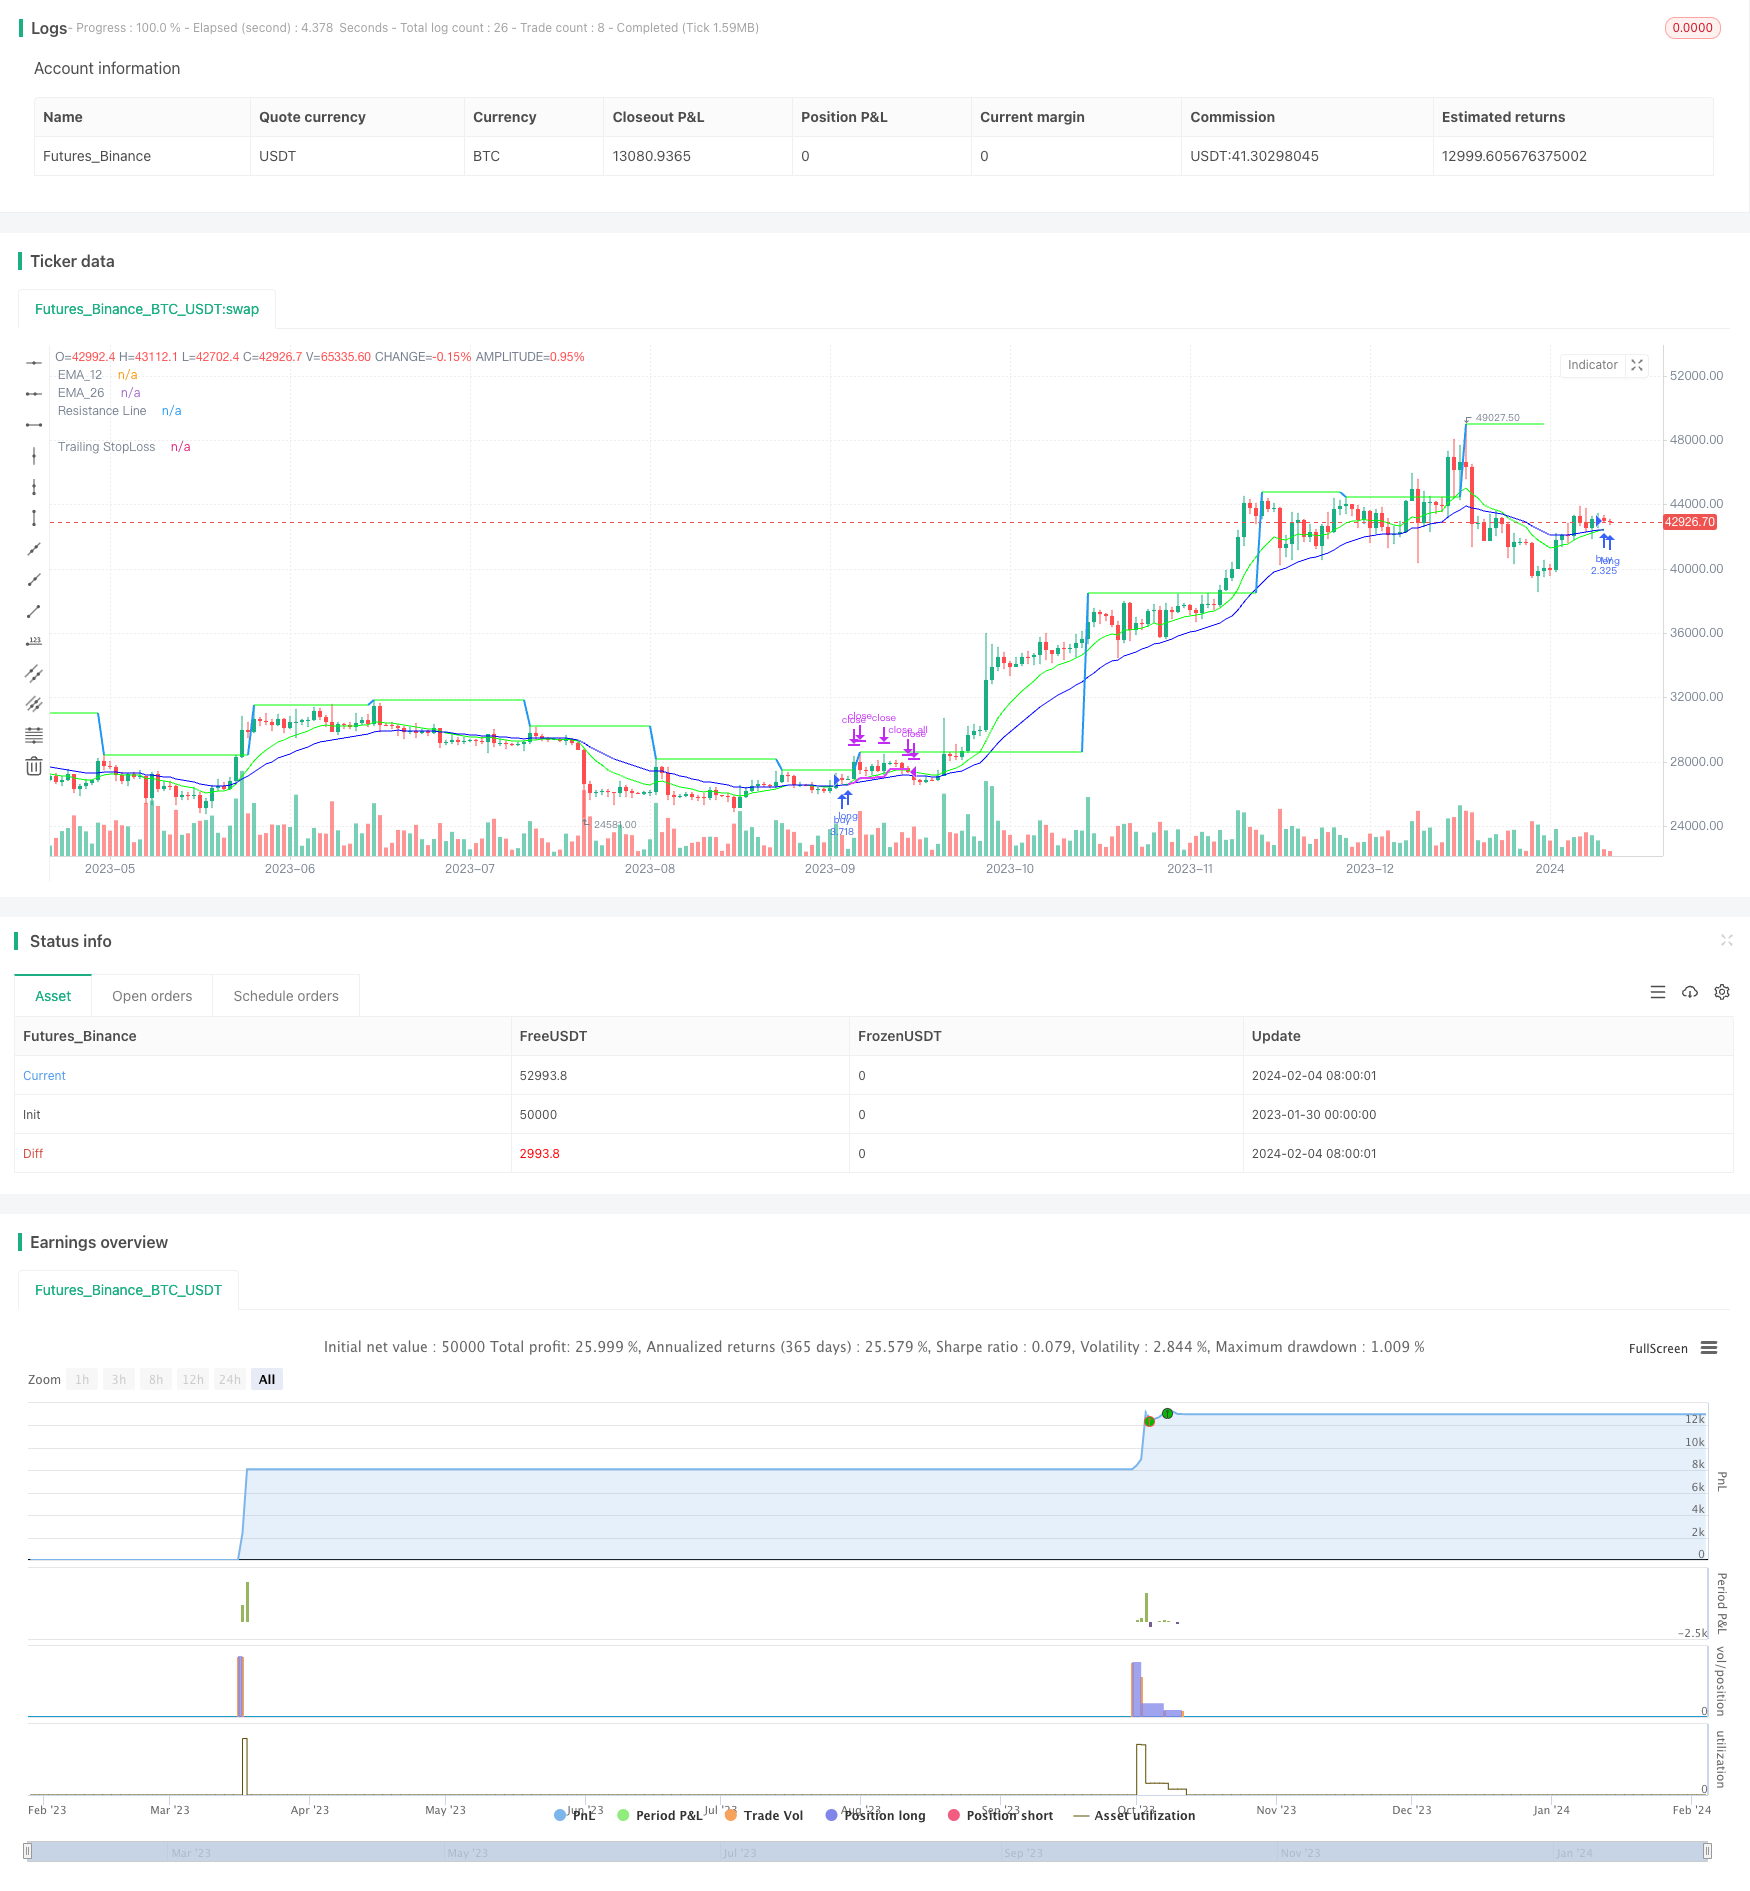
要約する
この戦略は,均線システムを主要取引信号として使用し,MACD,RSIなどの指標で入場フィルタリングを補助する.止損方法と止損目標の両方が最適化され,パラメータを調整して異なるタイプの投資家にマッチすることができます.戦略の最適化スペースは広大であり,入場信号,止損方法,止まり目標などの複数の次元からテストおよび改善することができ,戦略の効果をより良くする.
ストラテジーソースコード
/*backtest
start: 2023-01-30 00:00:00
end: 2024-02-05 00:00:00
period: 1d
basePeriod: 1h
exchanges: [{"eid":"Futures_Binance","currency":"BTC_USDT"}]
*/

// This source code is subject to the terms of the Mozilla Public License 2.0 at https://mozilla.org/MPL/2.0/
// © AbdulRahimShama
//@version=5


strategy('12/26-IT strategy', overlay=true,initial_capital = 100000)


Show_Only_12_26_Crossover_Entry = input.bool(true, group = "Entry_Exit Criteria")
Show_12_26_Crossover_and_resistance_Entry = input.bool(false, group = "Entry_Exit Criteria")


Show_TSL_StopLoss = input.bool(true, group = "Entry_Exit Criteria")
Show_Crossdown_StopLoss = input.bool(true, group = "Entry_Exit Criteria")
Show_SMA7_StopLoss = input.bool(false, group = "Entry_Exit Criteria")


////////////////////////////////////////////////
////////////////TARGETS INPUT
////////////////////////////////////////////////

////////Target1

TargetPerc1 = input.float(title="Target (%)", minval=0,defval=5, group="Target-1") / 100
TargetPrice1 = strategy.position_avg_price * (1 + TargetPerc1)
Target1_exit_qty = input.int(50, group="Target-1",tooltip = "% qty to sell when Target1 is reached")


////////Target2

TargetPerc2 = input.float(title="Target (%)", minval=0,defval=10, group="Target-2") / 100
TargetPrice2 = strategy.position_avg_price * (1 + TargetPerc2)
Target2_exit_qty = input.int(100, group="Target-2",tooltip = "% qty to sell when Target2 is reached")


////////////////////////////////////////////////
////////////////TRAILING STOP LOSS
////////////////////////////////////////////////


TSLsource = input(low, title="TSL Source", group="Trailing StopLoss")

longTrailPerc = input.float(title='Trail Long Loss (%)', minval=0.0, step=0.1, defval=1, group="Trailing StopLoss") * 0.01

TrailStopPrice = 0.0

TrailStopPrice := if strategy.position_size > 0
    sPIVOT_highValue = TSLsource * (1 - longTrailPerc)
    math.max(sPIVOT_highValue, TrailStopPrice[1])
else
    0

TSL = close < TrailStopPrice
plot(series=strategy.position_size > 0 and Show_TSL_StopLoss ? TrailStopPrice : na, color=color.new(color.fuchsia, 0), style=plot.style_linebr, linewidth=2, title='Trailing StopLoss')


////////////////////////////////////////////////
////////////////Moving Averages
////////////////////////////////////////////////


EMA_12=ta.ema(close, 12)
EMA_26=ta.ema(close, 26)
EMA_21=ta.ema(close,21)

plot(EMA_12, title="EMA_12", color=color.rgb(0, 255, 0), offset=0, linewidth=1)
plot(EMA_26, title="EMA_26", color=color.rgb(0, 0, 255), offset=0, linewidth=1)
plot(Show_SMA7_StopLoss ? ta.sma(close,7) : na, title="SMA_7", color=color.rgb(255, 0, 0), offset=0, linewidth=1)


////////////////////////////////////////////////
////////////////RESISTANCE INPUT and PLOTTING
////////////////////////////////////////////////

CrossOverLookbackCandles = input.int(10, group= "RESISTANCE")

resistanceSRC = input(high, group= "RESISTANCE")
resistanceLEFT = input(10, group= "RESISTANCE")
resistanceRIGHT = input(10, group= "RESISTANCE")

hih = ta.pivothigh(resistanceSRC, resistanceLEFT, resistanceRIGHT)
top = ta.valuewhen(hih, resistanceSRC[resistanceRIGHT], 0)

res = plot(top, color=top != top[1] ? na : color.new(#00ff00, 50), offset=-resistanceLEFT, linewidth=2, title="Resistance Line")

EMA_12_Low = ta.lowest(EMA_12, CrossOverLookbackCandles)
EMA_26_Low = ta.lowest(EMA_26, CrossOverLookbackCandles)


////////////////////////////////////////////////
////////////////RSI INPUT and PLOTTING
////////////////////////////////////////////////
RSI = ta.rsi(close, 14)
RSILowerRange = input.int(50, tooltip = "RSI value should be ABOVE this value for entry", group = "RSI")
RSIUpperRange = input.int(70, tooltip = "RSI value should be BELOW this value for entry", group = "RSI")


////////////////////////////////////////////////
////////////////MACD
////////////////////////////////////////////////
fast_length = 12
slow_length = 26
MACD_src = close
signal_length = 9

fast_ma = ta.ema(MACD_src, fast_length)
slow_ma = ta.ema(MACD_src, slow_length)
macd = fast_ma - slow_ma
signal = ta.ema(macd, signal_length)
hist = macd - signal


////////////////////////////////////////////////
////////////////ENTRY CRITERIA
////////////////////////////////////////////////


BUYVALUE= input(100000, tooltip = "Buy qty displayed on chart will be based on this value")

BASEENTRY = macd > signal and RSI > RSILowerRange and RSI < RSIUpperRange and close > EMA_21 and close > ta.sma(close, 7)


Entry= ta.crossover(EMA_12, EMA_26) and BASEENTRY
Entry2 = ta.crossover(close, top) and EMA_12_Low < EMA_26_Low and EMA_12 > EMA_26 and RSI < 70

////////////////////////////////////////////////
////////////////BUY SELL STRATEGY
////////////////////////////////////////////////

if ((Entry and Show_Only_12_26_Crossover_Entry))
    strategy.entry("buy", strategy.long, qty=BUYVALUE/close)

if (Entry2 and Show_12_26_Crossover_and_resistance_Entry)
    strategy.entry("buy", strategy.long, qty=BUYVALUE/close)

strategy.exit("Tg1", "buy", limit=TargetPrice1, qty_percent = Target1_exit_qty)
strategy.exit("Tg2", "buy", limit=TargetPrice2, qty_percent = Target2_exit_qty)


if TSL and Show_TSL_StopLoss and close < EMA_12
    strategy.close_all ("sl")

if ta.crossunder(EMA_12, EMA_26) and Show_Crossdown_StopLoss
    strategy.close_all ("sl")

if ta.crossunder(close, ta.sma(close, 7)) and Show_SMA7_StopLoss
    strategy.close_all ("sl")