
1
Follow
1782
Followers
概要
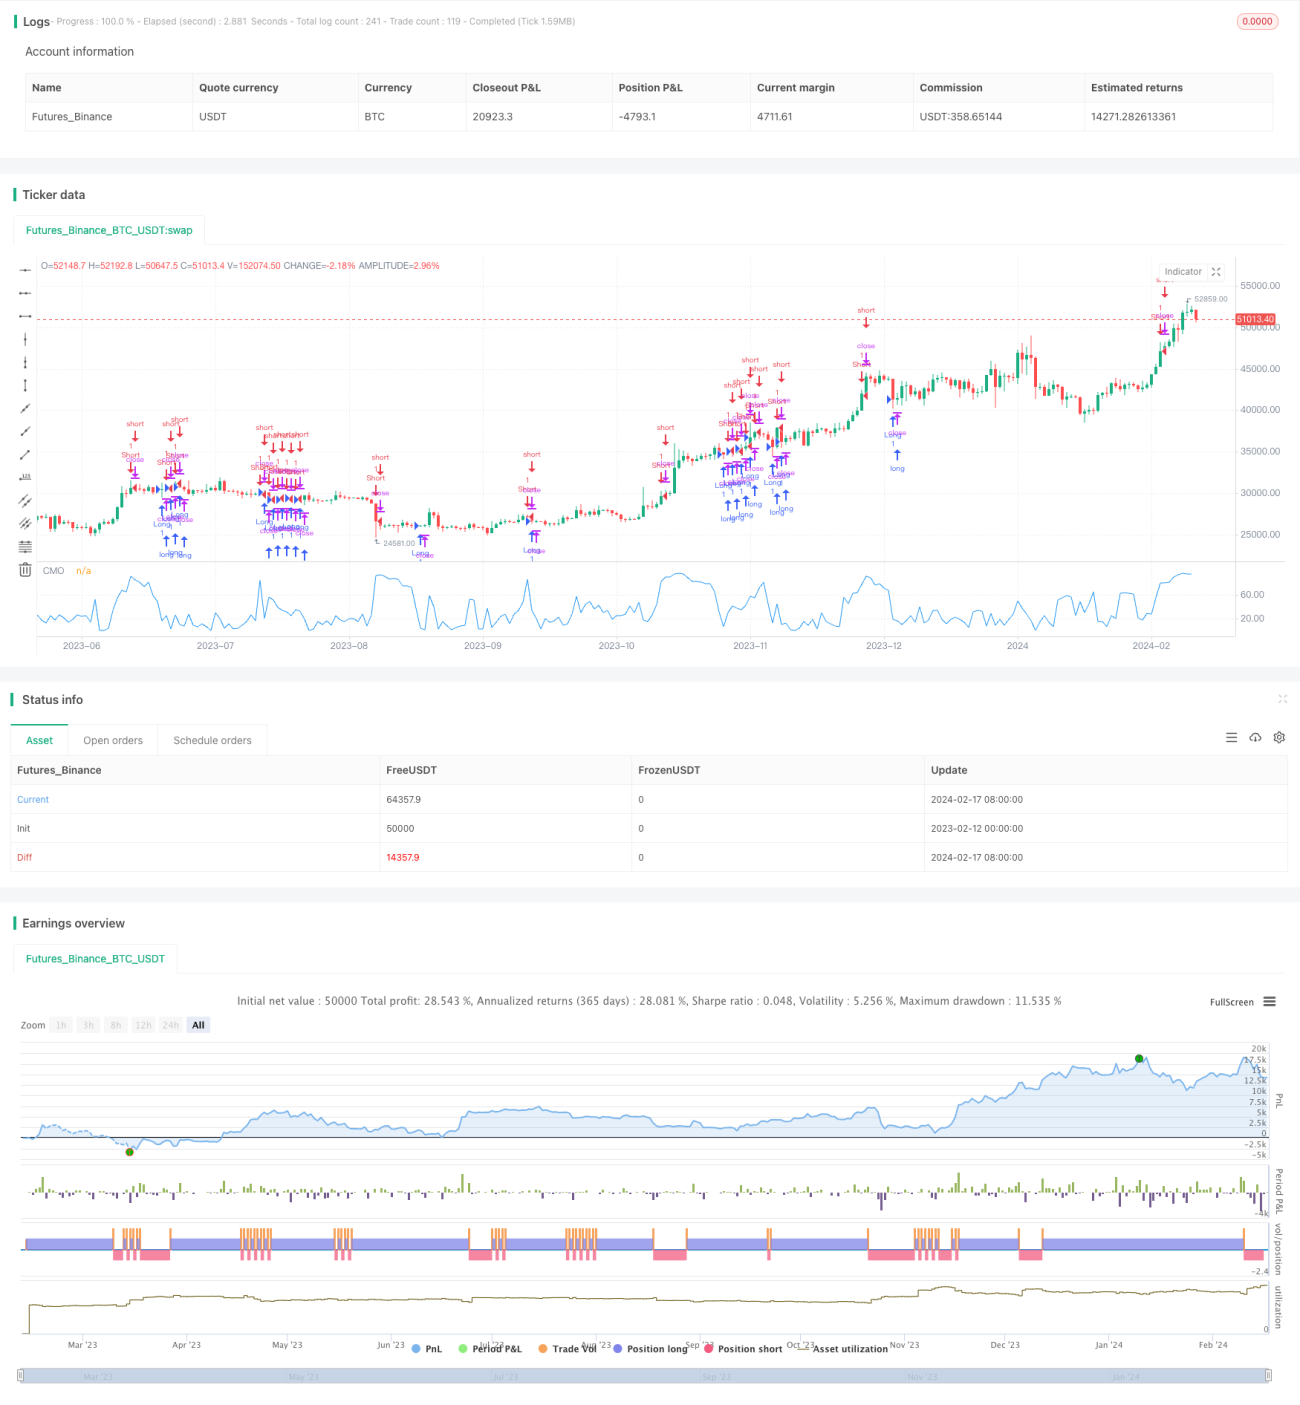
動的絶対値指数策略は,Tushar Chandeが開発した動的絶対値指数CMOの改良版である.この策略は,価格の絶対動的量値を計算して,市場が現在過買または過売状態にあるかどうかを判断し,市場の中期価格変動を捕捉する.
戦略原則
この戦略の核心指標は,改良されたCMO指標であるAbsCMOである.AbsCMOの計算式は以下のとおりである.
AbsCMO = abs(100 * (最新收盘价 - Length周期前的收盘价) / (Length周期内价格波动绝对值的简单移动平均 * Length))
その中で,Lengthは平均期間長さを表している。AbsCMO値の範囲は0から100。この指標は,動力の方向性と強さのmonumentalityを組み合わせ,市場の中期トレンドと超買い超売り領域を明確に判断できる。
AbsCMOの上線が指定された上線 ((デフォルト70)) を突破すると,市場が超買い,空白を表示する.AbsCMOの下線が指定された下線 (デフォルト20) を突破すると,市場が超売り,多出を表示する。
優位分析
他の動力指標と比較して,AbsCMO指標は以下の利点があります.
- 価格の絶対的な動きを反映し,市場の中期的な動向をより正確に判断する.
- オーバーバイの識別は,方向性と強さによってより明確になります.
- 制限範囲は0-100で,複数の品種間の比較がより適しています.
- 短期的な急激な波動に対して無感で,市場の中期的な傾向に反応する.
- カスタマイズ可能なパラメータ,適応力がある.
リスク分析
この戦略には以下のリスクがあります.
- 中期指数は短期的な変動に敏感に反応しない.
- 標準のパラメータは,すべての品種に当てはまらない可能性があり,最適化が必要である.
- 長期にわたって持っていたら,大きな引き下げになるかもしれない.
ポジション保持周期を適切に短縮したり,パラメータを最適化したり,他の指標の組み合わせで使用することでリスクを軽減することができます.
最適化の方向
この戦略は以下の点で最適化できます.
- AbSCMOのパラメータを最適化し,より多くの品種に対応する.
- 偽信号をフィルターする他の指標と組み合わせる
- リスク管理のための ストップ・アンド・ストップのルールを作ること
- ディープラーニングなどの技術と組み合わせて,より良い入学先を探す.
要約する
動量絶対値指数戦略は,全体的に比較して実用的な中期取引戦略である.価格の中期絶対動量特性を反応して,市場の中期傾向を判断する判断力が強い.しかし,この戦略は,短期的な急激な変動に無感であり,一定のリスクがある.パラメータ最適化,指標フィルタリング,止損機構などのさらなる改良により,この戦略の実盘パフォーマンスをより安定的に信頼できる.
Source
Pine
/*backtest
start: 2023-02-12 00:00:00
end: 2024-02-18 00:00:00
period: 1d
basePeriod: 1h
exchanges: [{"eid":"Futures_Binance","currency":"BTC_USDT"}]
*/

//@version=2
////////////////////////////////////////////////////////////
//  Copyright by HPotter v1.0 17/02/2017
// This indicator plots the absolute value of CMO. CMO was developed by Tushar Strategy parameters
Related strategies
Comment
All comments (0)
No data
- 1