移動平均線のクロスオーバーに基づくトレンドフォロー戦略

1
Follow
1782
Followers
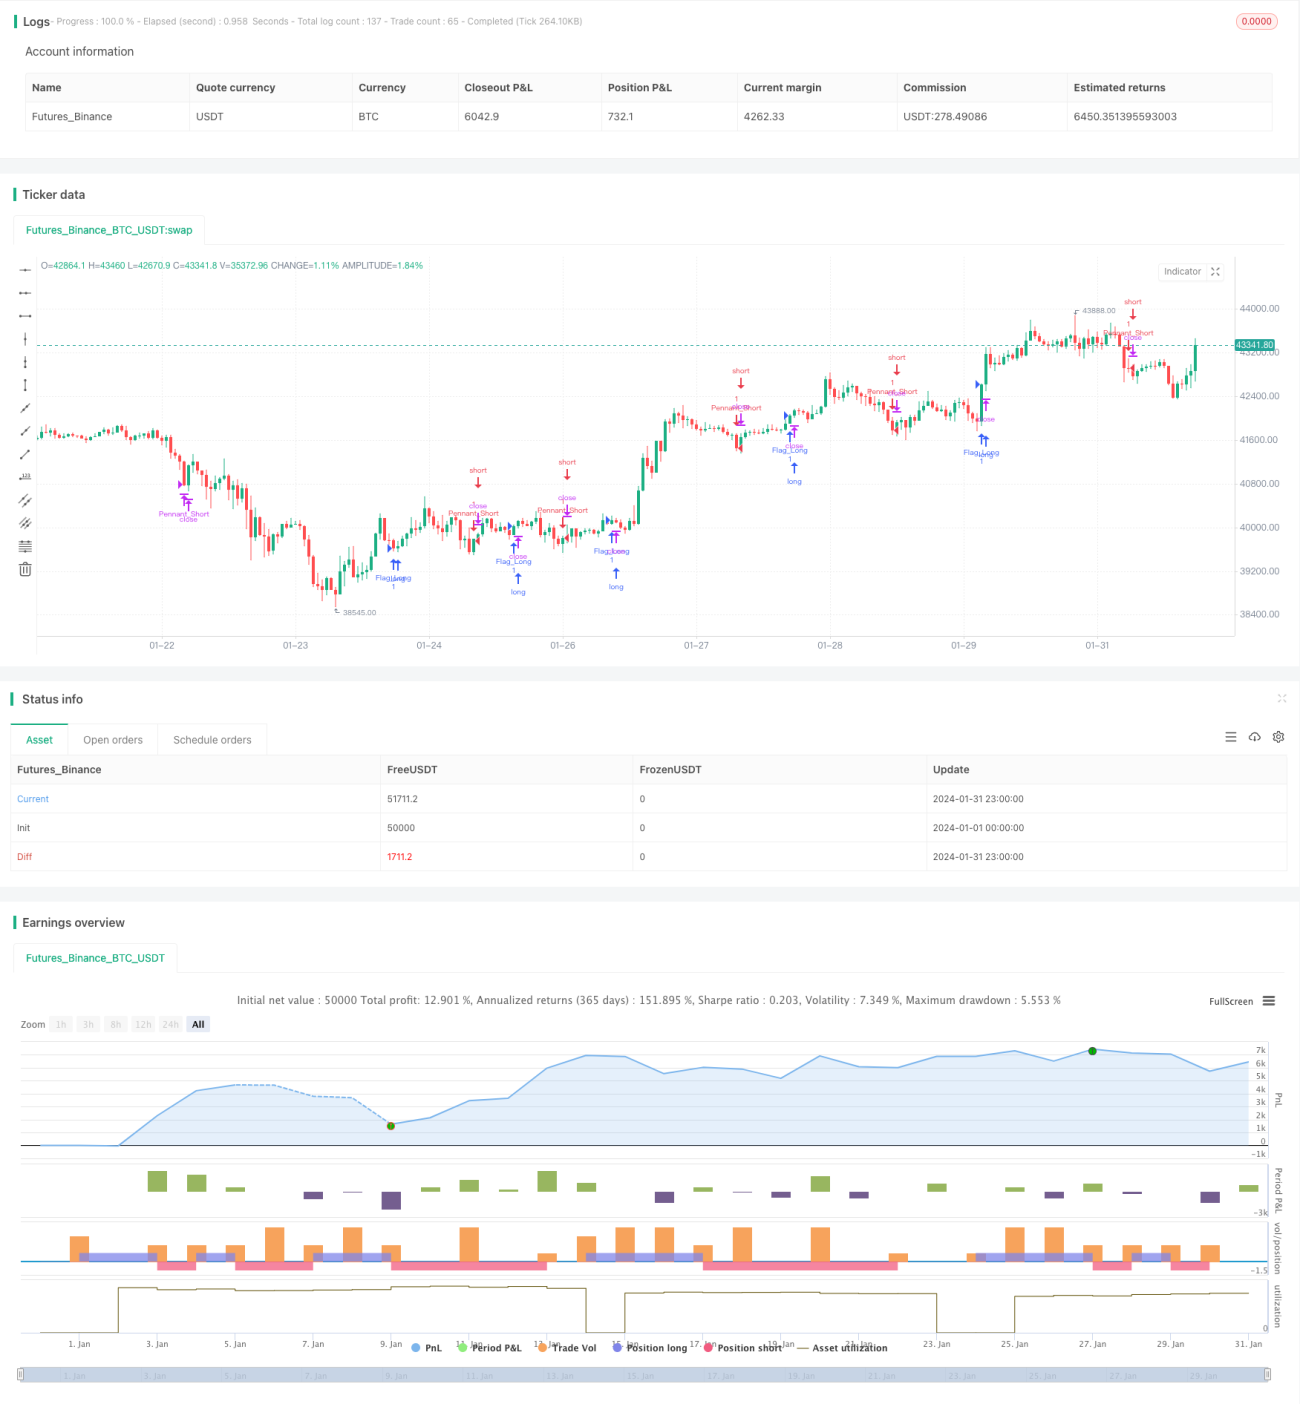
概要
この戦略は,均線交差に基づいて市場のトレンドの方向を判断し,トレンドを追跡する量化取引戦略である.この戦略は,購入と販売のタイミングを判断するために,複数の異なるパラメータの単純な移動平均の交差を適用する.
戦略原則
この戦略の主要な判断ルールは以下の通りです.
- 短期平均線が長期平均線を下から突破すると,多角的なトレンドに入っている可能性を示し,その時に多額の取引を行う.
- 短期平均線が長期平均線より上方から下落すると,空頭トレンドに入っている可能性を示し,空売りする.
- 異なるパラメータを使用した平均線は,異なるレベルのトレンドを判断し,異なる時間帯のトレンド追跡を実現します.
具体的には,20日線,30日線,50日線,60日線,200日線を5つの移動平均として使用している.20日線が50日線を上方から交差すると買入信号と判断し,10日線が30日線を下方から交差すると売出信号と判断する.異なるパラメータの平均線を使用して,より長期的およびより短期的なトレンド方向を判断することができる.
戦略的優位性
この均線交差に基づくトレンド追跡戦略は以下の利点があります.
- 操作がシンプルで,理解し,実行しやすい.
- 市場動向の方向性や強さを効果的に判断できる.
- 異なるパラメータの設定により,異なる時間帯のトレンド追跡が可能になります.
- カスタマイズ度が高く,自分の必要に応じて平均線パラメータを調整できます.
戦略リスク
この戦略にはいくつかのリスクがあります.
- 平均線は遅延性があり,遅延が生じることがあります.
- 誤った均線パラメータ設定は,過剰な取引信号と不必要な損失を引き起こす可能性があります.
- この策略は,明らかにトレンドしている状況で使用すべきであり,整合状況で使用しないように注意が必要です.
リスクを下げるために,平均線パラメータを調整し,パラメータの設定を最適化し,他の指標を使用して意思決定を補助することができます.
戦略最適化の方向性
この戦略は,以下の点で改善できます.
- 平均線パラメータを最適化して,最適なパラメータの組み合わせを見つけ,取引頻度を低下させながら,<unk>利率を向上させる.
- 意思決定の正確性を高めるために,RSI,KDなどの他の技術指標を追加する.
- リスクの管理に有効な策略として 早期の脱退を導入する.
- 複雑な機械学習モデルと組み合わせてパラメータ最適化と戦略評価を行い,継続的にエレガントにエスカレートします.
要約する
この戦略は,非常に基本的なトレンド追跡戦略である. 均線交差原理を使用して,市場トレンドの方向を判断し,シンプルで有効で,容易に理解できる実装である. 我々は,より複雑な量的な取引に適用するために,この基礎を大きく拡張し,最適化することができます. 全体として,これは非常に良い戦略の基本枠組みである.
Source
Pine
Related strategies
Comment
All comments (0)
No data
- 1