3倍指数移動平均と相対力指数を組み合わせた1分足チャートに基づく暗号通貨定量取引戦略

1
Follow
1782
Followers
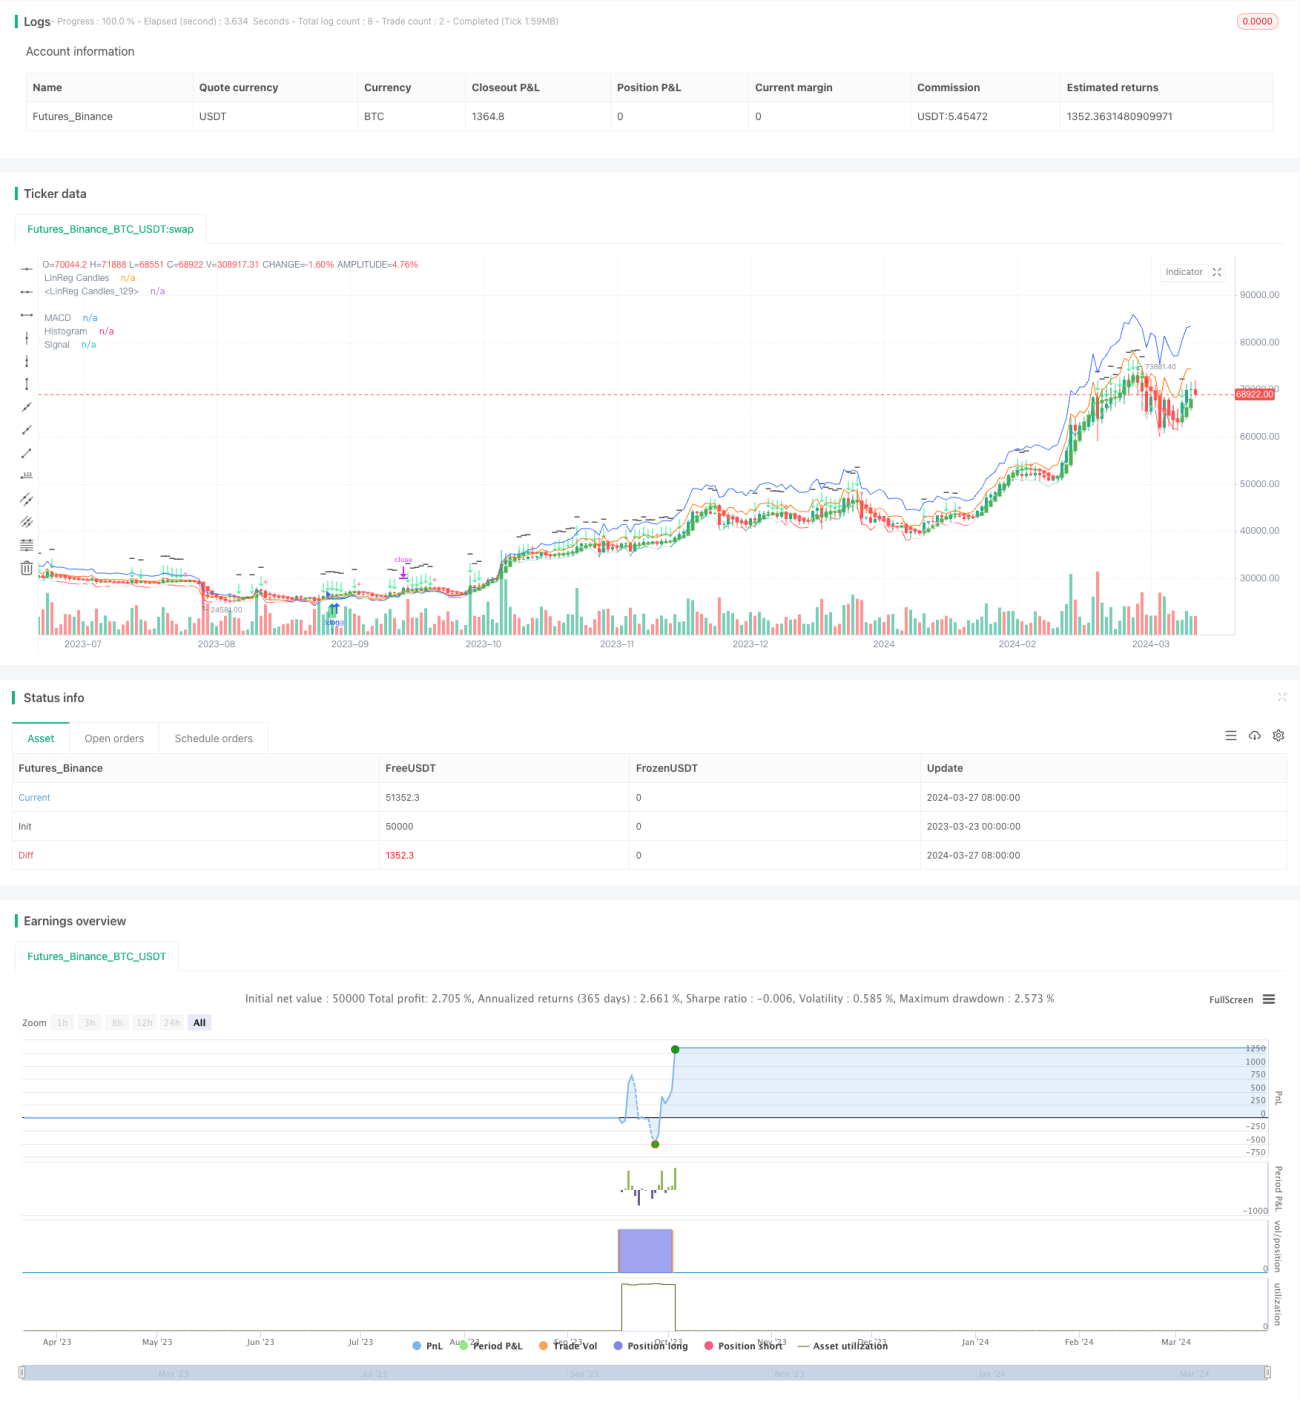
概要
この戦略は,三回指数平均移動線 ((Triple MACD) と相対的に強い指数 ((RSI) を組み合わせた方法を採用し,1分間の時間周期に特化した暗号通貨市場の量化取引を行う.戦略の主な考え方は,異なる周期パラメータのMACD指標を使用して市場の多気量変化を捉え,傾向の強さを確認するためにRSI指標を使用することです.三回MACD信号を平均することで,スライドノイズを効果的に平衡させ,取引信号の信頼性を高めることができます.
戦略原則
この策略は,3つの異なるパラメータのMACD指標を使用し,それぞれ速線周期5/13/34と慢線周期8/21/144で,それらの間の差を計算してMACD値を得ます. そして,これらの3つのMACDを平均し,平均後のMACD値を減算してSignal値 (すなわちMACDの周期NEMA) を取得し,最終的なMACD柱状図が得られます. 14サイクルRSI指標を計算すると,トレンドの強さを判断するのに役立ちます.
優位分析
- 多周期パラメータを使用したMACD指標の組み合わせは,異なる時間尺度の下での市場の傾向変化を客観的に反映し,傾向判断の正確性を向上させる.
- MACDとRSIを組み合わせて,厳格な開口条件を形成し,戦略的利益を高め,撤退を制御するのに役立ちます.
- 平均MACD信号は,指標の頻繁な振動による偽信号を効果的に排除し,取引信号をより信頼性のあるものにする.
- 線形回帰の判断により,動揺する市場のトレンドが不明なときに入場を避けるため,損失を伴う取引を減らすことができる.
- 瞬く間に変化する仮想通貨市場では,1分単位での量化取引戦略は,市場の波動によって生じる取引機会をより早く捉えるのに役立ちます.
リスク分析
- 策略は,長期にわたって市場が広い幅の振動状態にある場合,取引シグナルが頻繁に失効する可能性があるため,一方的なトレンドの状況で優れたパフォーマンスを発揮します.
- 仮想通貨市場の波動が大きいため,短期間の極端な異常な波動が発生した場合,大幅な撤退を引き起こす可能性があります.
- 策略パラメータの選択は,全体的な収益に明らかな影響があり,パラメータの設定が不適切である場合,策略が失敗する可能性があります.したがって,実用化する前に,異なる品種に対する十分なパラメータ最適化と反テスト検証が必要である.
最適化の方向
- 価格変動率に関連するATRなどの指標を導入し,ポジション開設シグナルをフィルタリングし,市場の異常な変動による損失を減らすことを考えることができます.
- 状況の整合判断のために,線形回帰以外にも,サポートレジスタンス位,ブリン帯通路などの他の方法を使用することを試みて,識別精度をさらに向上させることができる.
- トレンドの状況では,移動ストップを導入することで平準ポジションのポジションを最適化して,単一取引の収益を最大化することができる.
- 異なる取引品種の特徴の違いを考慮して,異なる品種に対して異なる戦略パラメータを設定し,全体的な戦略の適応性と安定性を向上させることができる.
要約する
この戦略は,三重MACDとRSIの指標を巧みに組み合わせ,線形回帰技術を利用して,横断状態を認識し,完全な高頻度量化取引戦略を形成している. 戦略の厳格な開設条件と平均MACD信号の適用は,取引の正確性を向上させ,逆転を制御するのに役立ちます. 戦略は,一方的なトレンド状態で優れたパフォーマンスを発揮しますが,波動率フィルタを導入し,横断状態を認識する方法を最適化し,移動ストップを設定し,異なる品種に対して独立したパラメータを設定するなどの措置を導入することで,戦略の適応性と安定性をさらに向上させることができます.
Source
Pine
Strategy parameters
Related strategies
Comment
All comments (0)
No data
- 1