マルチインジケータートレンド追跡動的リスク管理定量取引戦略

1
Follow
1782
Followers
概要
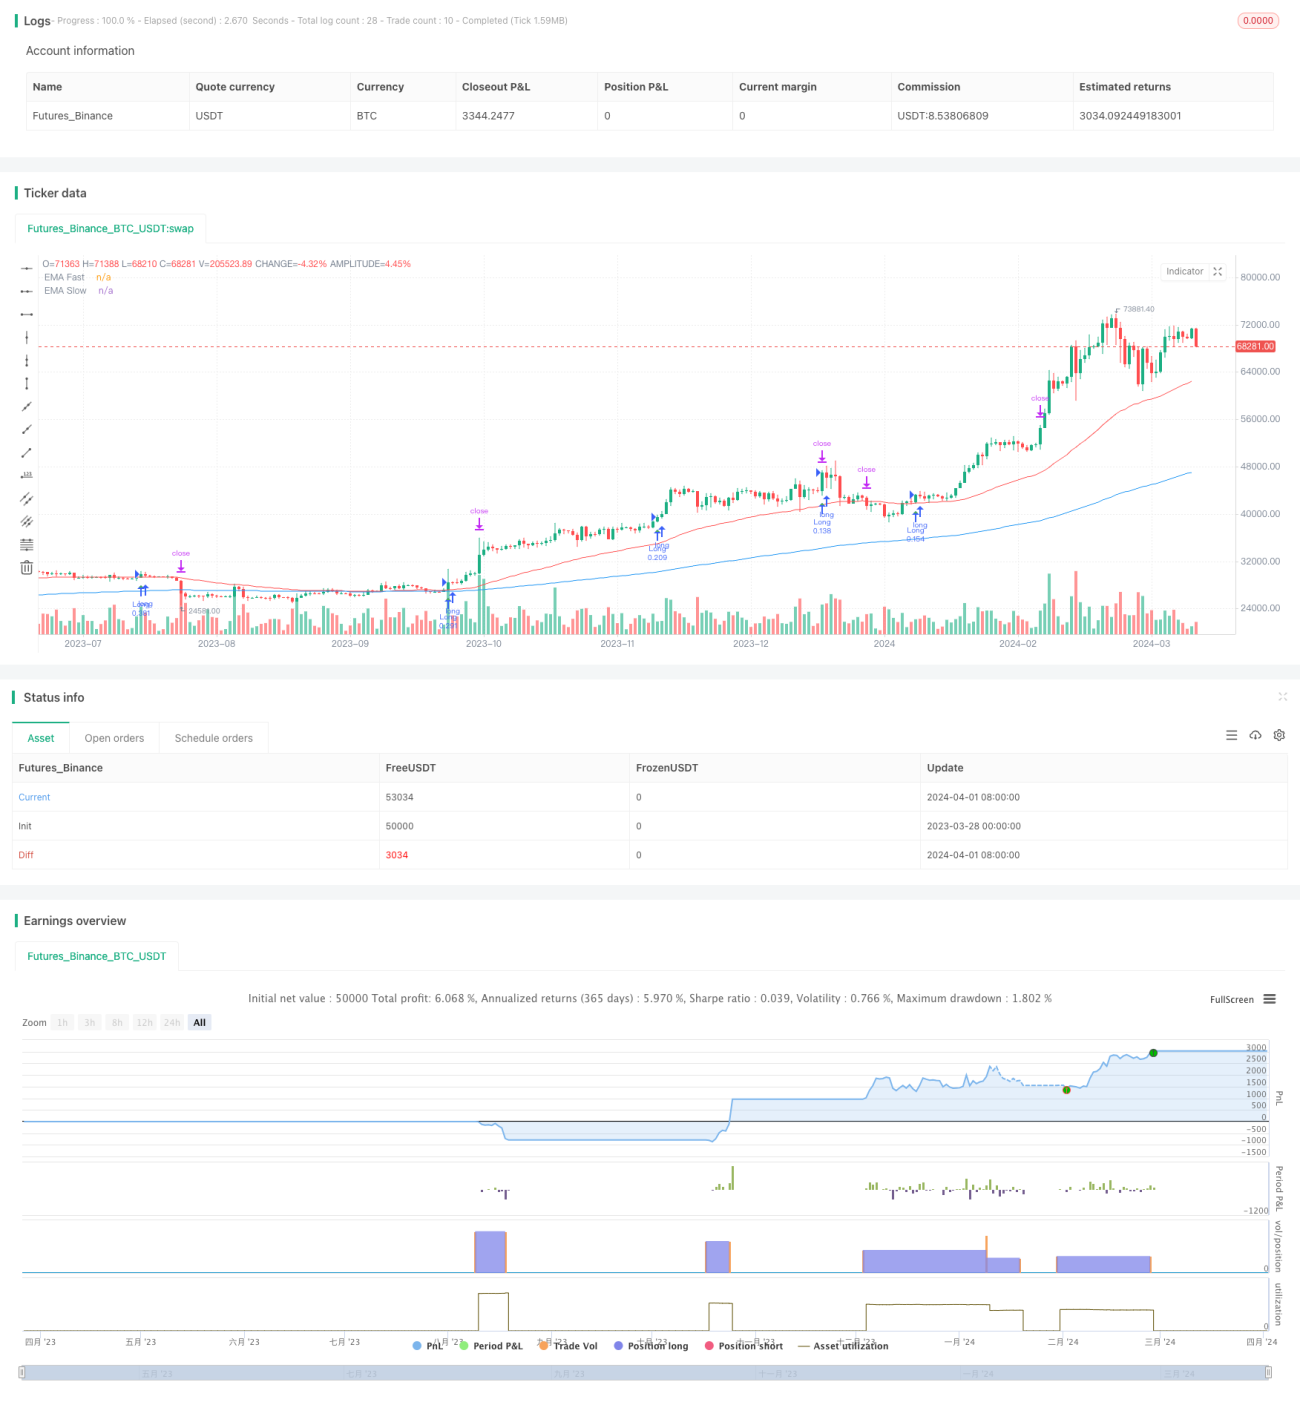
この戦略は,相対的に強い指数 ((RSI),移動平均収束散乱度指数 ((MACD),指数移動平均 ((EMA) と平均リアル波幅 ((ATR) といった複数の技術指標を採用し,ダイナミックなポジション管理とストップ・ストップ・ストップの仕組みを組み合わせ,包括的なトレンドを追跡する量化取引戦略を実現する.この戦略は,価格の速度,方向,強さ,そして波動率を分析し,複数の市場環境で自律的に調整し,市場動向を捉え,リスクを制御する.
戦略原則
- RSIは,価格変動の速度と幅を測定し,超買超売状態を識別し,取引のためのシグナルを提供します.
- MACDは,高速と遅い移動平均の差値分析を使用して,価格の動量,方向,および強さの変化を判断し,トレンドの転換点を提示します.
- 双 EMA の交差はトレンドの方向を確認し,快線が慢線を突破すると見多信号,快線が慢線を突破すると見空信号とみなす.
- ATRは市場の変動率を測定し,異なる市場の状況に合わせてストップとストップのレベルを動的に調整します.
- RSI,MACD,EMAの多重条件を組み合わせて,多頭トレンドの形成時に多頭ポジションを開く,空頭トレンドの形成時に空頭ポジションを開く.
- ATRをストップ・ローズ・レファレンスとして採用し,ダイナミック・プロフィット・ターゲットを設定し,単一取引のリスク/利益比は変わらない.
- 戦略的リスク<unk>口と標識の資産変動率に基づいて,各取引のポジションを動的に調整し,リスク<unk>口の恒定性を実現する.
戦略的優位性
- トレンド・トラッキング: 戦略は,複数の技術指標に基づいてトレンドを確認し,市場における中長期のトレンドの機会を効果的に捉えます.
- ダイナミック・ウィンドコントロール: ストップ・ローズとストップ・ストップのレベルはATRのダイナミックに合わせて調整され,異なる波動率の市場状態に対応し,単一取引のリスクを制御する.
- ポジション管理:口座の規模と指数の変動率を考慮して,取引のポジションを自動的に最適化して,全体のリスクの隙間を安定的に保つ.
- 適応性:戦略のパラメータは,異なる市場,品種,および投資スタイルに柔軟に調整できます.
- 厳格な規律: 量的なルールに基づいて取引を実行し,主観的な感情の影響を排除し,戦略の客観性と一致性を保証する.
戦略リスク
- 市場リスク:金融市場自体による不確実性,経済,政治,突発的な出来事などの要因の影響により,戦略のパフォーマンスが予想から逸脱する可能性があります.
- パラメータリスク:不適切なパラメータ設定により,戦略が過去データに過度に適合し,実際のアプリケーションで不良なパフォーマンスを引き起こす可能性があります.
- スリップポイントと取引コスト:実際の取引におけるスリップポイントと手数料は,戦略の純利益に影響する可能性がある.
- 極端な状況: 戦略は,急激に変化する変動率環境,流動性の枯渇などの極端な状況で,大きな撤退に直面する可能性があります.
戦略最適化の方向性
- 参数最適化: 戦略の安定性と適応性を向上させるため,最適な参数組み合わせを,歴史的データへの反省によって探す.
- 多空ポジションの動的配置:市場トレンドの強さと方向に応じて多空ポジションの比率を動的に調整し,トレンドの状況をよりよく把握する.
- 市場状況判断:変動率,関連性などの指標を組み合わせて,市場状態を判断し,異なる状態で相応の戦略調整を行う.
- 基本的分析と組み合わせて:マクロ経済,業界トレンドなどの基本的要因を考慮に入れ,技術指標の使用と解釈を指導する.
- リスク管理の最適化:ダイナミックなストップ・ストップの基礎に,ポートフォリオの最適化,ヘッジ・ツールの使用などの高度なリスク管理手段を追加する.
要約する
この戦略は,RSI,MACD,EMAなどの技術指標を有機的に組み合わせて,包括的なトレンド追跡取引システムを構築しています. この戦略は,動的なポジションとリスク管理を採用し,トレンドの機会を捉えながら引き戻しリスクを制御しています. この戦略は,市場特性と投資需要に応じて最適化調整を行うことができます. しかし,実際のアプリケーションでは,市場リスク,パラメータ設定,取引コストなどの要因に注意し,定期的に評価して最適化する必要があります. 慎重なリスク管理と継続的な最適化により,この戦略は,安定した高効率の量化取引ツールになる可能性があります.
Source
Pine
//@version=5
strategy("Enhanced Professional Strategy V6", shorttitle="EPS V6", overlay=true)

// Input parameters with tooltips for enhanced user understanding.
rsiPeriod = input.int(14, title="RSI Period", tooltip="Period length for the Relative Strength Index. Standard setting is 14. Adjust to increase or decrease sensitivity.")
macdFastLength = input.int(12, title="MACD Fast Length", tooltip="Length for the fast EMA in the MACD. Typical setting is 12. Adjust for faster signal response.")
macdSlowLength = input.int(26, title="MACD Slow Length", tooltip="Length for the slow EMA in the MACD. Standard setting is 26. Adjust for slower signal stabilization.")
macdSmoothing = input.int(9, title="MACD Smoothing", tooltip="Smoothing length for the MACD signal line. Commonly set to 9. Modifies signal line smoothness.")
atrLength = input.int(14, title="ATR Length", tooltip="Period length for the Average True Range. Used to measure market volatility.")
riskRewardRatio = input.float(2.0, title="Risk/Reward Ratio", tooltip="Your target risk vs. reward ratio. A setting of 2.0 aims for profits twice the size of the risk.")
emaFastLength = input.int(50, title="EMA Fast Length", tooltip="Period length for the fast Exponential Moving Average. Influences trend sensitivity.")
emaSlowLength = input.int(200, title="EMA Slow Length", tooltip="Period length for the slow Exponential Moving Average. Determines long-term trend direction.")Strategy parameters
Related strategies
Comment
All comments (0)
No data
- 1