어제 최고가 돌파 전략

개요
전일 최고가 돌파 전략은 추세 추종 전략으로, 전일 최고가를 돌파할 때 매수 포지션을 오픈합니다. 당일에 여러 번 돌파해도 포지션을 열 수 있습니다. 추세 추종을 주요 특징으로 하며, 시장이 뚜렷한 추세를 보이고 변동성이 높은 상황에 적합합니다.
원리
이 전략은 일련의 지표를 도입하여 진입 및 청산 타이밍을 식별합니다.
-
ROC 곡선 필터 – 당일 종가가 전일 종가 대비 상승/하락률이 설정된 임계값을 초과할 때 전략이 활성화됩니다. 이 지표는 전략에 부합하지 않는 변동성 시장을 걸러내는 데 사용됩니다.
-
돌파점 – 당일 고가, 저가, 시가를 기록합니다. 가격이 당일 고가를 돌파할 때 진입 신호가 발생합니다.
-
진입 및 청산 조건 – 진입 후 손절매 및 이익 실현 비율을 설정하며, 추적 손절매를 활성화하여 이익을 고정할 수 있습니다. 특정 EMA에 기반하여 조건부 손절매도 가능합니다.
-
최적화 설정 – 진입 전 간격 비율을 설정하여 진입 타이밍을 조정하고 가짜 돌파를 방지할 수 있습니다. 손절매, 이익 실현, 추적 손절매의 동적 매개변수를 설정할 수 있습니다.
구체적으로, 전략은 당일 고가를 기록하여 진입 타이밍을 판단합니다. 가격이 당일 고가를 초과하면 매수 진입합니다. 이후 손절매 및 이익 실현 청산 조건이 설정되며, 추적 손절매를 활성화할 수 있습니다. 또한 가격이 특정 EMA 아래로 하락할 때 손절매할 수도 있습니다. 최적화 방식은 진입 전 간격 비율을 설정하고, 손절매 및 이익 실현 비율을 조정하여 위험을 제어하며, 추적 손절매를 활성화하여 이익을 고정합니다.
장점 분석
해당 전략은 다음과 같은 장점이 있습니다:
-
추세 추종으로 추세장에서 수익을 포착할 수 있습니다.
-
돌파 전략으로 진입 신호가 명확합니다.
-
당일 고가를 고려하여 연속 진입을 방지합니다.
-
손절매 및 이익 실현 설정으로 위험 관리에 도움이 됩니다.
-
추적 손절매 설정으로 이익을 고정할 수 있습니다.
-
매개변수 최적화를 통해 진입 타이밍을 조정하고 위험을 제어할 수 있습니다.
-
단순하고 직관적이며 이해와 구현이 쉽습니다.
-
매수 및 매도 양방향으로 활용 가능합니다.
위험 분석
이 전략은 다음과 같은 위험도 존재합니다:
-
돌파형 전략은 쉽게 물릴 위험이 있습니다. 진입 후 가격이 즉시 하락할 수 있습니다.
-
추세장에만 효과적이며, 횡보장에서는 성과가 좋지 않습니다.
-
손절매 비율을 합리적으로 설정해야 하며, 너무 느슨하면 손실이 증가할 수 있습니다.
-
진입 간격 비율을 합리적으로 설정해야 하며, 너무 공격적이면 손실이 증가할 수 있습니다.
-
가짜 돌파로 인한 불필요한 손실이 발생할 수 있으며, 조정 및 최적화가 필요합니다.
-
돌파 시 거래량이 후속 흐름을 지지할 수 있는지 확인해야 합니다.
-
다양한 시간 프레임의 매개변수 설정 간의 조화를 고려해야 합니다.
최적화 방향
해당 전략은 다음과 같은 측면에서 최적화할 수 있습니다:
-
거래량, 오실레이터 등 다른 기술 지표를 추가하여 횡보장에서 물리는 것을 방지합니다.
-
곡선 피팅 지표를 추가하여 추세의 질을 판단하고 가짜 추세를 따르는 것을 방지합니다.
-
진입 간격을 동적으로 최적화하여 시장 변동성에 따라 간격 요구 사항을 조정합니다.
-
손절매 및 이익 실현을 동적으로 최적화하여 시장에 맞게 매개변수를 조정합니다.
-
다양한 종목과 시간 프레임에 대해 서로 다른 매개변수를 설정합니다.
-
머신러닝 방법을 사용하여 다양한 매개변수가 전략에 미치는 영향을 테스트합니다.
-
옵션 기능을 추가하여 구성을 최적화합니다.
-
횡보장에서 이 전략을 적용하는 방법을 연구합니다.
-
여러 시간 프레임과 종목을 아우르는 조합 전략으로 확장합니다.
요약
이 전략은 전일 최고가 돌파를 기반으로 한 추세 추종 아이디어로, 추세장에서 좋은 성과를 보입니다. 그러나 물릴 위험과 매개변수 최적화의 어려움이 있습니다. 더 많은 판단 지표 도입, 동적 매개변수 최적화, 조합 전략으로의 확장 등을 통해 추가 최적화가 가능합니다. 전반적으로 이 전략은 단기 추세장에 적합하지만, 위험 관리와 매개변수 최적화에 주의해야 합니다.
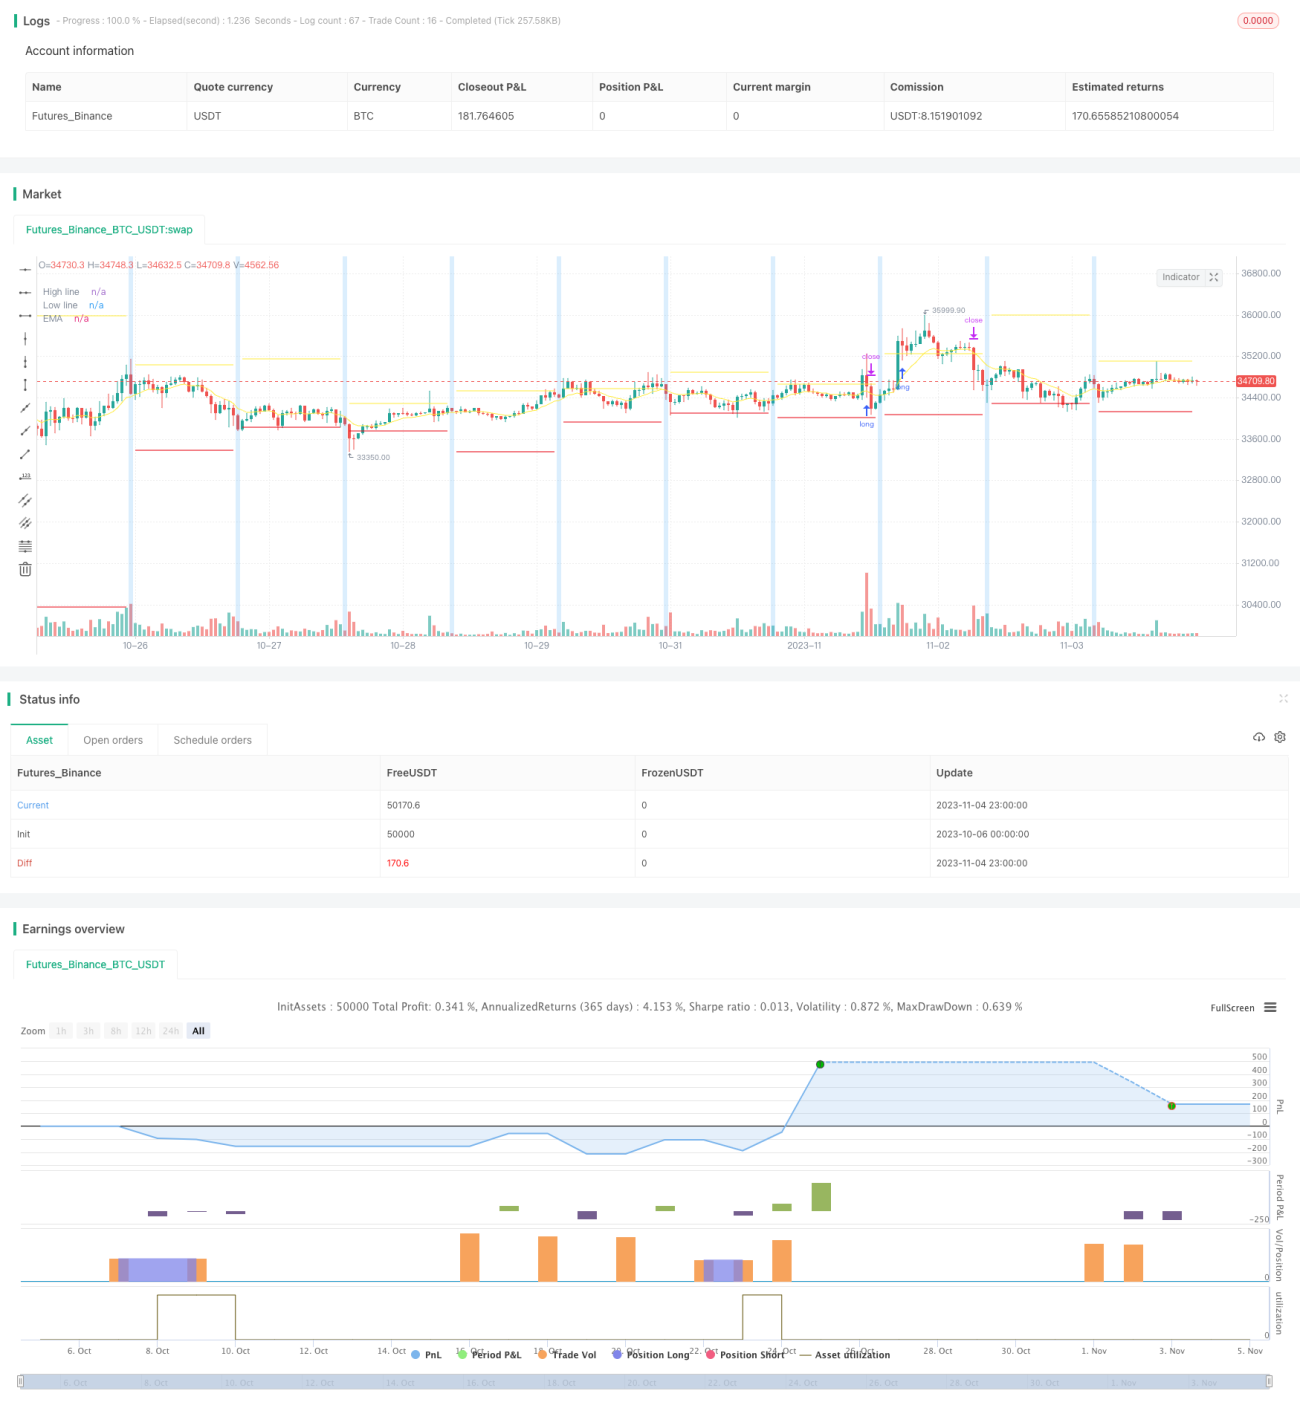
/*backtest
start: 2023-10-06 00:00:00
end: 2023-11-05 00:00:00
period: 1h
basePeriod: 15m
exchanges: [{"eid":"Futures_Binance","currency":"BTC_USDT"}]
*/

// This source code is subject to the terms of the Mozilla Public License 2.0 at https://mozilla.org/MPL/2.0/
// Author: © tumiza 999
// © TheSocialCryptoClub
- 1