다중 지표 변동성 밴드 거래 전략

개요
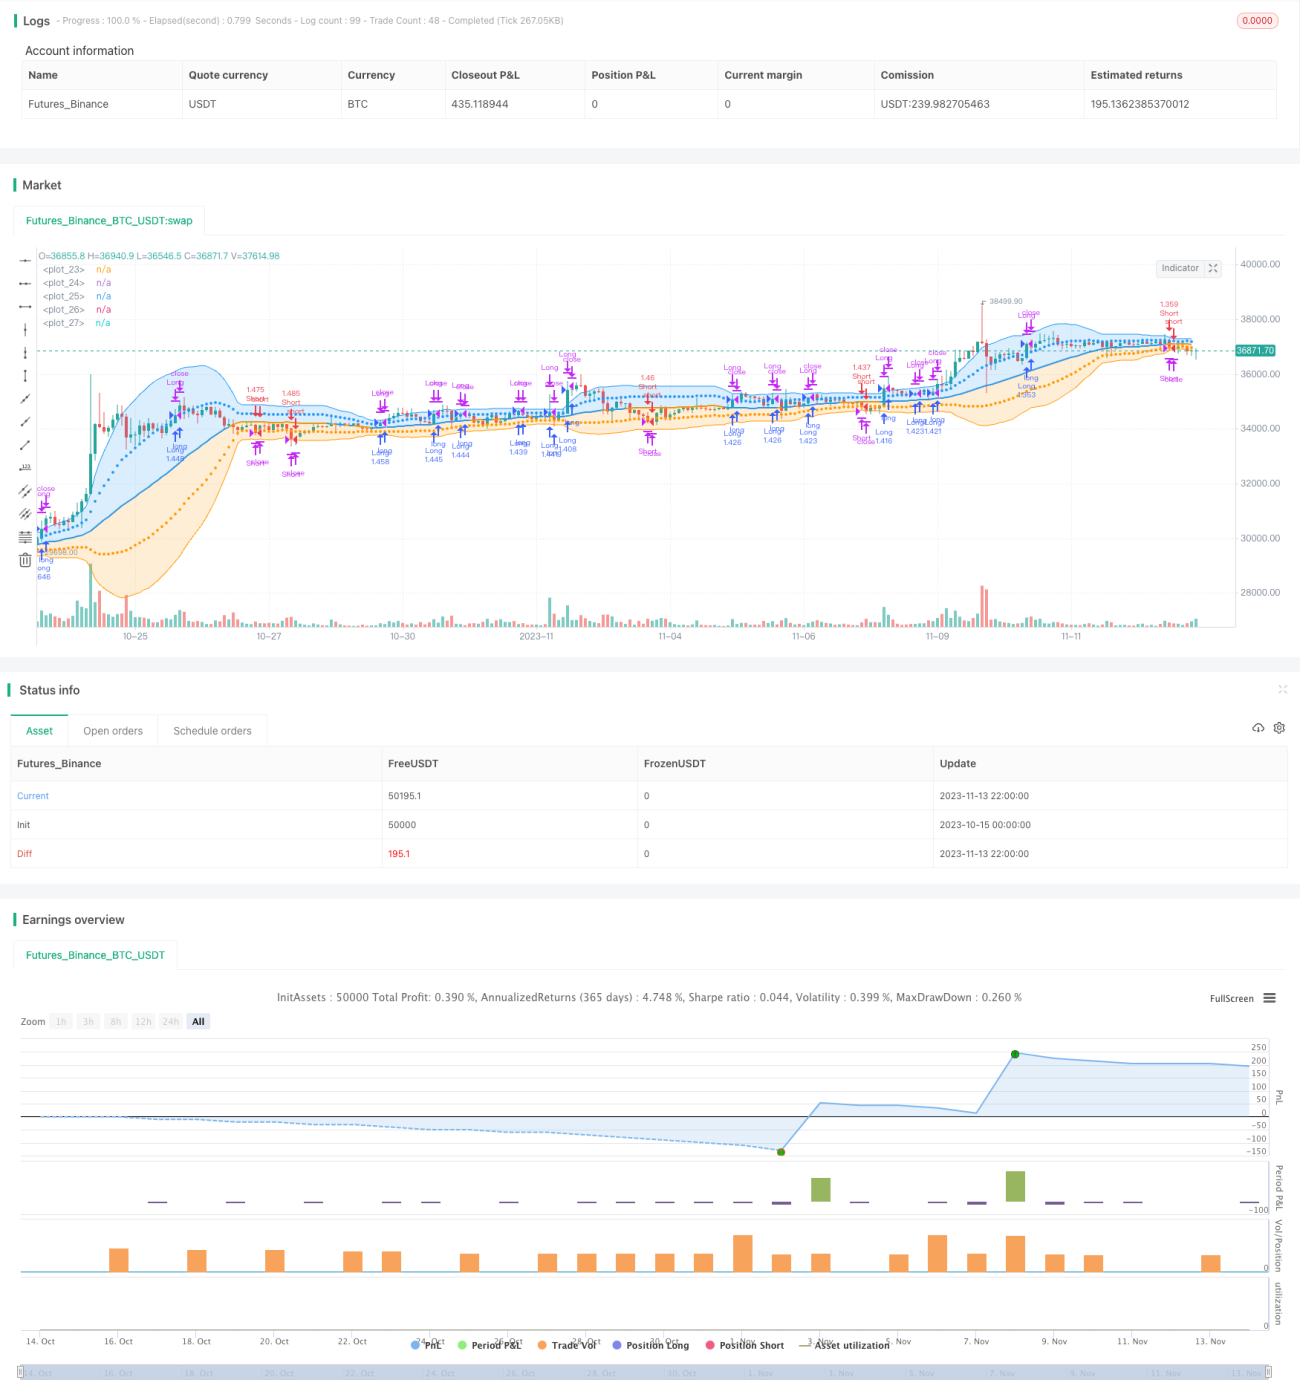
이 전략은 거래 결정을 내리기 위해 여러 가지 기술 지표, 즉 파동 영역, 상대적으로 약한 지표 및 이동 평균 분산 지표를 통합적으로 사용합니다. 전략은 먼저 차트에 전통적인 파동 영역을 그리고, 두 가지 색상의 띠 모양의 영역으로 두 가지 다른 표준 차이의 차이를 나타냅니다. 그리고 파동 영역이 뚫렸는지 여부에 따라 입장을 결정합니다.
전략 원칙
-
우선, 전략은 34주기의 진동선을 도표에 그리며, 중도, 1개의 표준차와 2개의 표준차의 상하도를 포함한다.
-
종결가격이 궤도를 통과할 때, 다단점 포지션을 실시한다. 종결가격이 궤도를 통과할 때, 빈점 포지션을 실시한다.
-
다수수 포지션을 보유할 때, 폐가격 아래로 중간 궤도를 통과하면, 청탁 포지션은 다분하다. 공수 포지션을 보유할 때, 폐가격 위로 중간 궤도를 통과하면, 청탁 포지션은 공허하다.
-
전략은 또한 RSI 지표를 도입했습니다. RSI가 70보다 높을 때 다단계 입장을 추가로 확인하고, RSI가 30보다 낮을 때 공백 입장을 추가로 확인합니다.
-
RSI 상위 50을 넘으면 공평한 위치. RSI 하위 50을 넘으면 공평한 위치.
-
전략은 또한 MACD 지표, MACD 금 포크에 대 한 다 머리 입점의 추가 확인, MACD 죽은 포크에 대 한 빈 머리 입점의 추가 확인을 도입했다.
-
MACD 죽은 포크 때, 평점 상권이 <unk>. MACD 금 포크 때, 평점 상권이 비<unk>.
-
종합적으로, 이 전략은 변동폭, RSI 및 MACD의 세 가지 지표가 동시에 충족되기 전에 입장을 열 수 있습니다. 평형 상태는 또한 세 가지 지표를 고려하여 잘못된 신호의 가능성을 줄입니다.
우위 분석
여러 지표의 필터링 신호를 종합적으로 활용하여 잘못된 거래를 효과적으로 피할 수 있습니다. 변동이 가격 돌파 신호를 가져오고, RSI 필터링은 과매매 현상을 초과하고, MACD 필터링은 시장 추세 변화를 확인하고, 세 가지 모두 함께 신호를 확인하여 수익 가능성을 크게 향상시킬 수 있습니다.
이 전략은 또한 다른 포지션 개시 및 포지션 논리를 설정하여 포지션 위험을 엄격하게 제어합니다. 중도, RSI 중축 50 및 MACD의 금포크도 포크는 평평한 포지션 조건으로 도입되어 단위 손실을 줄이는 빠른 손실을 줄일 수 있습니다.
단일 지표 전략에 비해 이 전략은 여러 지표의 장점을 통합하여 수익률과 승률을 크게 높이고 최대 회수율을 낮출 수 있다. 다중 지표 조합 필터는 잘못된 거래의 가능성을 줄일 수 있으며, 엄격한 중지 손실 메커니즘은 각 손실 거래의 영향을 제어할 수 있다.
전체적으로, 이 전략은 중장기 트렌드 트레이딩에 매우 적합하며, 시장의 주요 트렌드를 포착할 수 있고, 지표의 세부 사항을 활용하여 포착되는 것을 피할 수 있습니다. 다중 지표 위험 제어 메커니즘은 또한 높은 레버리지를 안전하게 사용할 수 있습니다.
위험 분석
이 전략에는 다음과 같은 몇 가지 위험이 있습니다.
-
지표가 가짜 신호를 발산할 확률. 여러 지표를 합성하면 잘못된 신호를 줄일 수 있지만 완전히 제거하는 것은 불가능하다. 지표 매개 변수를 최적화하여 가짜 신호율을 줄이는 것이 필요하다.
-
일방적인 시장상황에서 수익을 얻을 수 없다. 추세가 흔들릴 때, 중지 손실이 유발될 수 있으며, 지속 가능한 수익을 얻을 수 없다. 적절한 중지 손실 기준을 완화하여 지분 기간을 연장할 수 있다.
-
일부 지표는 지연되어 최적의 시점을 놓칠 수 있습니다. 더 진보된 지표를 테스트하여 전환을 일찍 잡을 수 있습니다.
-
대량의 점프 공백은 중지 손실을 무효화한다. 통로 중지 손실을 설정하거나 손실을 제어하기 위해 점진적으로 포지션을 올릴 수 있다.
-
매개 변수는 너무 고정되어 있고, 각 시장에 따라 조정할 필요가 있다. 기계 학습 자동 최적화 매개 변수는 도입될 수 있다.
-
테스트 데이터 부족, 과다 적합성이 있을 수 있습니다. 전략의 안정성은 더 긴 기간과 다양한 시장에서 테스트해야 합니다.
최적화 방향
이 전략은 다음의 몇 가지 측면에서 더 개선될 수 있습니다.
-
지표 파라미터를 최적화하여 보다 적합한 오동대주기, RSI주기 및 MACD 파라미터 조합을 찾아서 거짓 신호를 감소시킨다. 단계적 방법, 거침 방법 등의 방법으로 최적의 파라미터를 찾을 수 있다.
-
고정된 중궤도 정지 대신 자율적 정지 메커니즘을 추가한다. ATR, 트렌드 등의 요인을 결합하여, 동적으로 정지 위치를 조정할 수 있다.
-
기계 학습 기술을 도입하여 매개 변수의 적응적 최적화를 구현한다. 강도 학습을 사용하여 다른 시장 조건에서 매개 변수를 최적화할 수 있다.
-
트렌드를 판단하는 규칙을 추가하고, 다른 단계에 따라 다른 전략을 사용하는 것을 구별하고, 전략의 동적 적응력을 향상시킵니다.
-
텍스트 분석, 소셜 데이터 등과 결합하여 다중 요소 예측을 강화하고, 더 진보된 지표를 사용하여 전환점을 미리 판단할 수 있습니다.
-
수익률을 최적화하고, 투자 금액에 따라 포지션 규모를 조정하여 수익이 지수형 성장을 달성 할 수 있도록하십시오.
-
포트폴리오를 최적화하고, 포트폴리오 수익의 변동성을 줄이기 위해 비관계를 이용하는 상호 보완적 전략을 찾습니다.
요약하다
이 전략은 여러 가지 기술 지표를 통합하여 입문 및 출구를 판단하며 엄격한 중지 규칙을 설정합니다. 단일 지표에 비해 다중 지표 조합은 거짓 신호를 크게 줄이고 수익률을 높일 수 있습니다. 중지 규칙은 또한 손실의 영향을 제어 할 수 있습니다. 이 전략은 추세 상황에 적합하며 높은 안정적인 수익을 얻을 수 있습니다.
/*backtest
start: 2023-10-15 00:00:00
end: 2023-11-14 00:00:00
period: 2h
basePeriod: 15m
exchanges: [{"eid":"Futures_Binance","currency":"BTC_USDT"}]
*/

//@version=5
// Bollinger Bands: Madrid : 14/SEP/2014 11:07 : 2.0
// This displays the traditional Bollinger Bands, the difference is
// that the 1st and 2nd StdDev are outlined with two colors and two- 1