
이 전략은 가격의 퍼센트 변화를 사용하여 구매 라인 및 중지 라인을 설정하고, 구매 라인을 깨는 가격에 따라 포지션을 구축하고, 중지 라인 아래에서 중지한다. 그것의 주요 특징은 단 1 단위의 위험을 감수하는 것 이다. 즉, 상위 포지션이 기본 수익 목표를 달성 한 후에만 포지션을 추가한다.
이 전략은 먼저 기준 가격을 설정하고, 이 가격의 10%를 가격 범위에 두고, 상한은 구매 라인이고, 하한은 중지 라인이다. 가격이 구매 라인을 깨면, 고정된 양으로 구매한다. 가격이 중지 라인을 넘어지면, 평소 위치 중지한다. 수익을 얻은 후, 구매 라인과 중지 라인은 수익 영역을 확장하는 비율로 조정된다.
이 전략의 또 다른 중요한 점은 단 1 단위의 위험을 감수하는 것이다. 즉, 현재 포지션이 수익 목표에 도달한 후에만 새로운 포지션을 매장한다. 새로운 포지션은 또한 새로운 구매 라인 및 중지 라인에 의해 설정된다. 이것은 위험을 제한할 수 있다.
이 전략은 트래킹 스톱로스 (tracking stop loss) 와 포지션 관리 (storage management) 의 장점을 결합하여, 위험을 효과적으로 통제하면서 수익을 창출할 수 있습니다.
이 전략에는 몇 가지 위험도 있습니다.
이러한 위험은 파라미터를 조정하여 피할 수 있습니다. 예를 들어, 비율 분기 크기를 조정하거나, 부가 조건을 조정합니다.
이 전략에는 더 많은 최적화가 가능합니다.
이것은 퍼센티지 간격을 이용한 거래 전략이다. 그것은 간단하고 실용적이며 위험을 효과적으로 통제한다. 매개 변수 조정과 모델 최적화를 통해, 이 전략은 투자자에게 안정적인 초과 수익을 창출하는 신뢰할 수 있는 트렌드 추적 시스템이 될 수 있다.
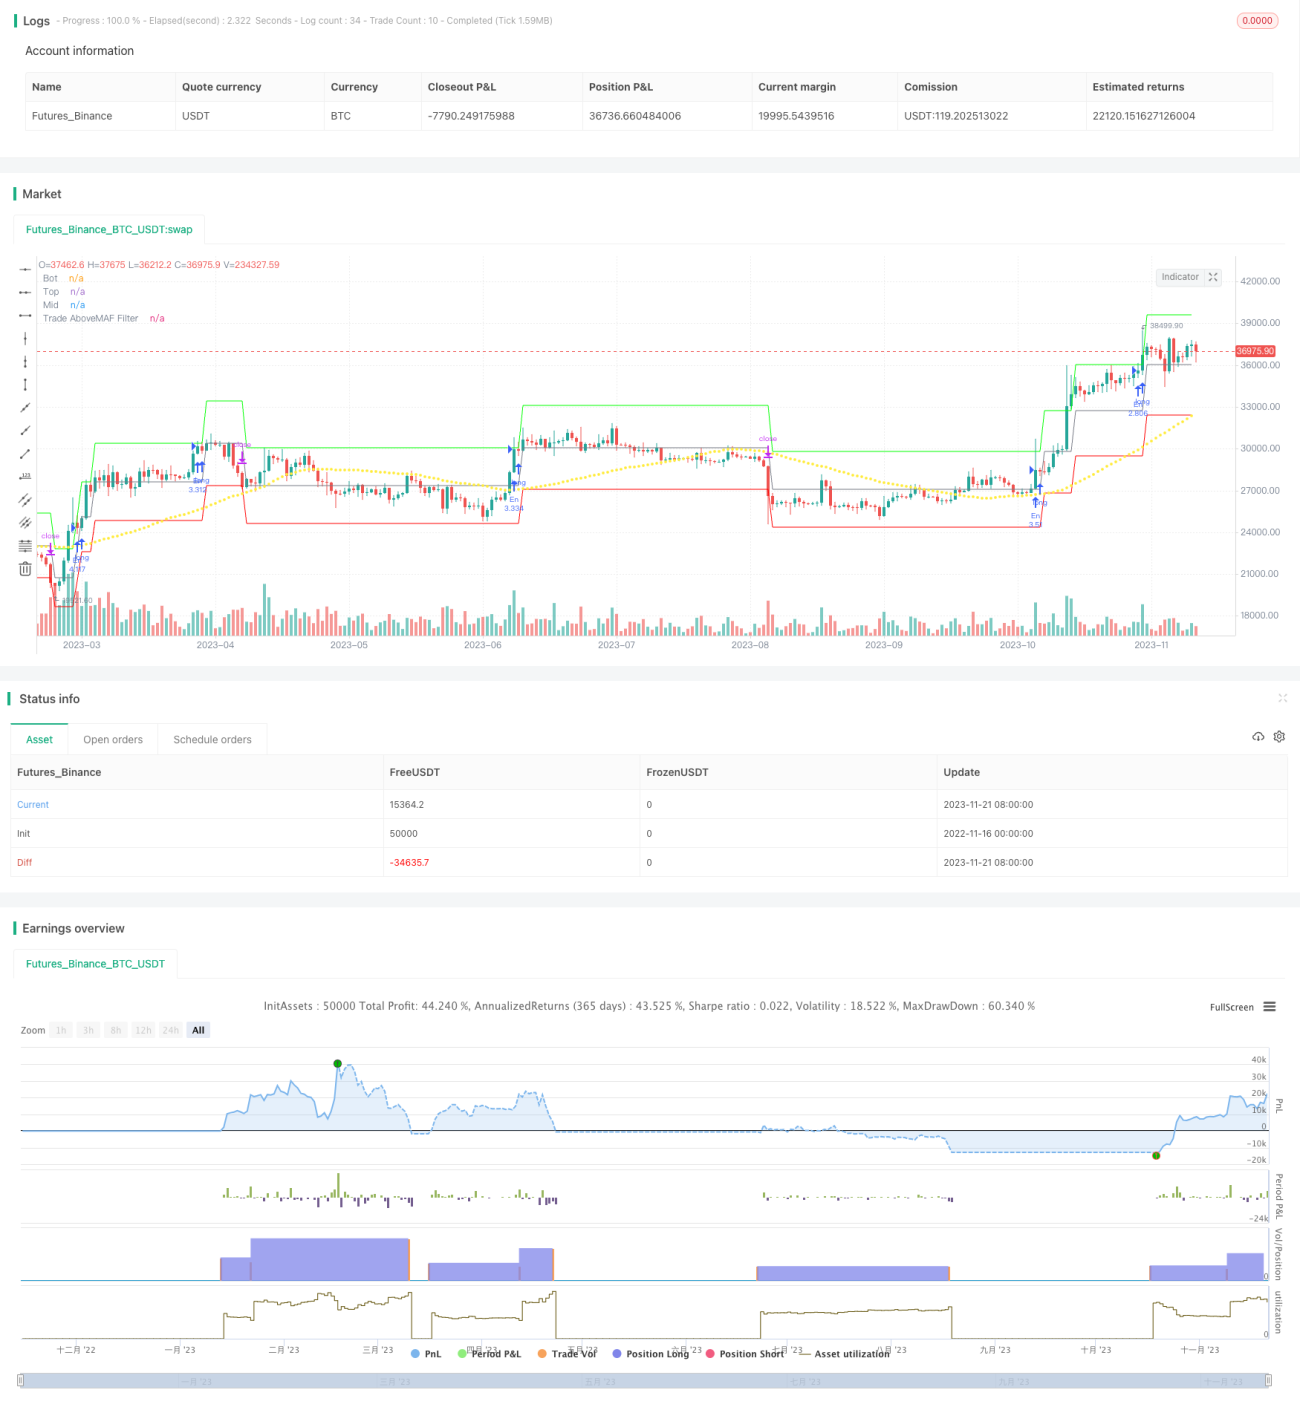
/*backtest
start: 2022-11-16 00:00:00
end: 2023-11-22 00:00:00
period: 1d
basePeriod: 1h
exchanges: [{"eid":"Futures_Binance","currency":"BTC_USDT"}]
*/
//@version=4
// This source code is subject to the terms of the Mozilla Public License 2.0 at https://mozilla.org/MPL/2.0/
// © HermanBrummer 4 April 2021
strategy ("The Box Percent Strat", shorttitle="The Box", overlay = true)
/// Designed for LONG only on Daily, 2D or 3D Charts
/// Uses fixed investment risk amount, meaning you're willing to lose that amount per trade
/// Limit buy to not overpay
RiskPerTrade = input(10000, "Risk losing this much per trade", tooltip="This calculates how much you will lose based on difference between the entry price and stop loss price")
TradeAboveMAFilterPer = input(50, "The System won't trade if price is below this MA")
UpBoxSize = (input(10, "Box size in %") * 0.01)+1 // 1.1 == 10% up
DnBoxSize = 1-(input(10, "Box size in %") * 0.01) // 0.9 == 10% dn
var FirstBar = close > 0 ? close : na
var FirstTop = FirstBar * UpBoxSize
var FirstBot = FirstBar * DnBoxSize
var top = sma(FirstTop, 1)
var bot = sma(FirstBot, 1)
/// The Box Calcs
if high[2] > top
top := top * UpBoxSize
bot := bot * UpBoxSize
if low[1] < bot
top := top * DnBoxSize
bot := bot * DnBoxSize
plot(bot, "Bot", #ff0000) // Green
plot(top, "Top", #00ff00) // Red
mid = ((top-bot)/2)+bot
plot(mid, "Mid", color.gray)
TradeAboveMAFilter = sma(close, TradeAboveMAFilterPer)
plot(TradeAboveMAFilter, "Trade AboveMAF Filter", color.yellow, 3, style=plot.style_circles)
// col = high[1] < top and high >= top ? color.white : na
// bgcolor(col)
/// Shares
RiskRange = close * abs(DnBoxSize - 1) // 0.9 - 1 == 1.10 // 10% abs so you don't get a neg number NB NB
Shares = RiskPerTrade / RiskRange
//plot(close-RiskRange, "RiskRange", color.fuchsia)
Enter = high >= top
and close[1] > TradeAboveMAFilter
and strategy.opentrades[0] == strategy.opentrades[1]
and strategy.opentrades[1] == strategy.opentrades[2]
and strategy.opentrades[2] == strategy.opentrades[3]
and strategy.opentrades[3] == strategy.opentrades[4]
and strategy.opentrades[4] == strategy.opentrades[5]
and strategy.opentrades[5] == strategy.opentrades[6]
// won't enter if new positon was taken in the last 6 bars
// need better code for this.
/// Buy & Sell
// (new highs) and (Close above moving average filter) and (No new trades were taken receently)
if Enter //(high >= top) and (close[1] > TradeAboveMAFilter) and strategy.opentrades[0] == strategy.opentrades[1]
strategy.order("En", strategy.long, qty=Shares, limit=top)//, stop=top)
//barcolor(strategy.position_size != 0 ? #00ff00 : color.gray)
// /// If ONE Position THEN this Stop Because:
// if strategy.position_size == 1
// strategy.exit("Ex", "En", stop=bot)
/// If it has more than one trad OPEN
if strategy.position_size > 0
strategy.exit("Ex", "En", stop=bot[2] ) // puts stop on old bot
//plot(strategy.position_avg_price, "Avg Price", color.yellow)