개요
공간 지향 가격 역전 전략은 가격 통로 중심선을 계산하여 가격 변동의 경향 방향을 판단한다. 가격이 통로 중심선에 가까워질 때, 더 많이 또는 더 적게 할 신호를 낸다. 이 전략은 여러 필터링 조건을 결합하여 높은 확률의 거래 기회를 찾는다.
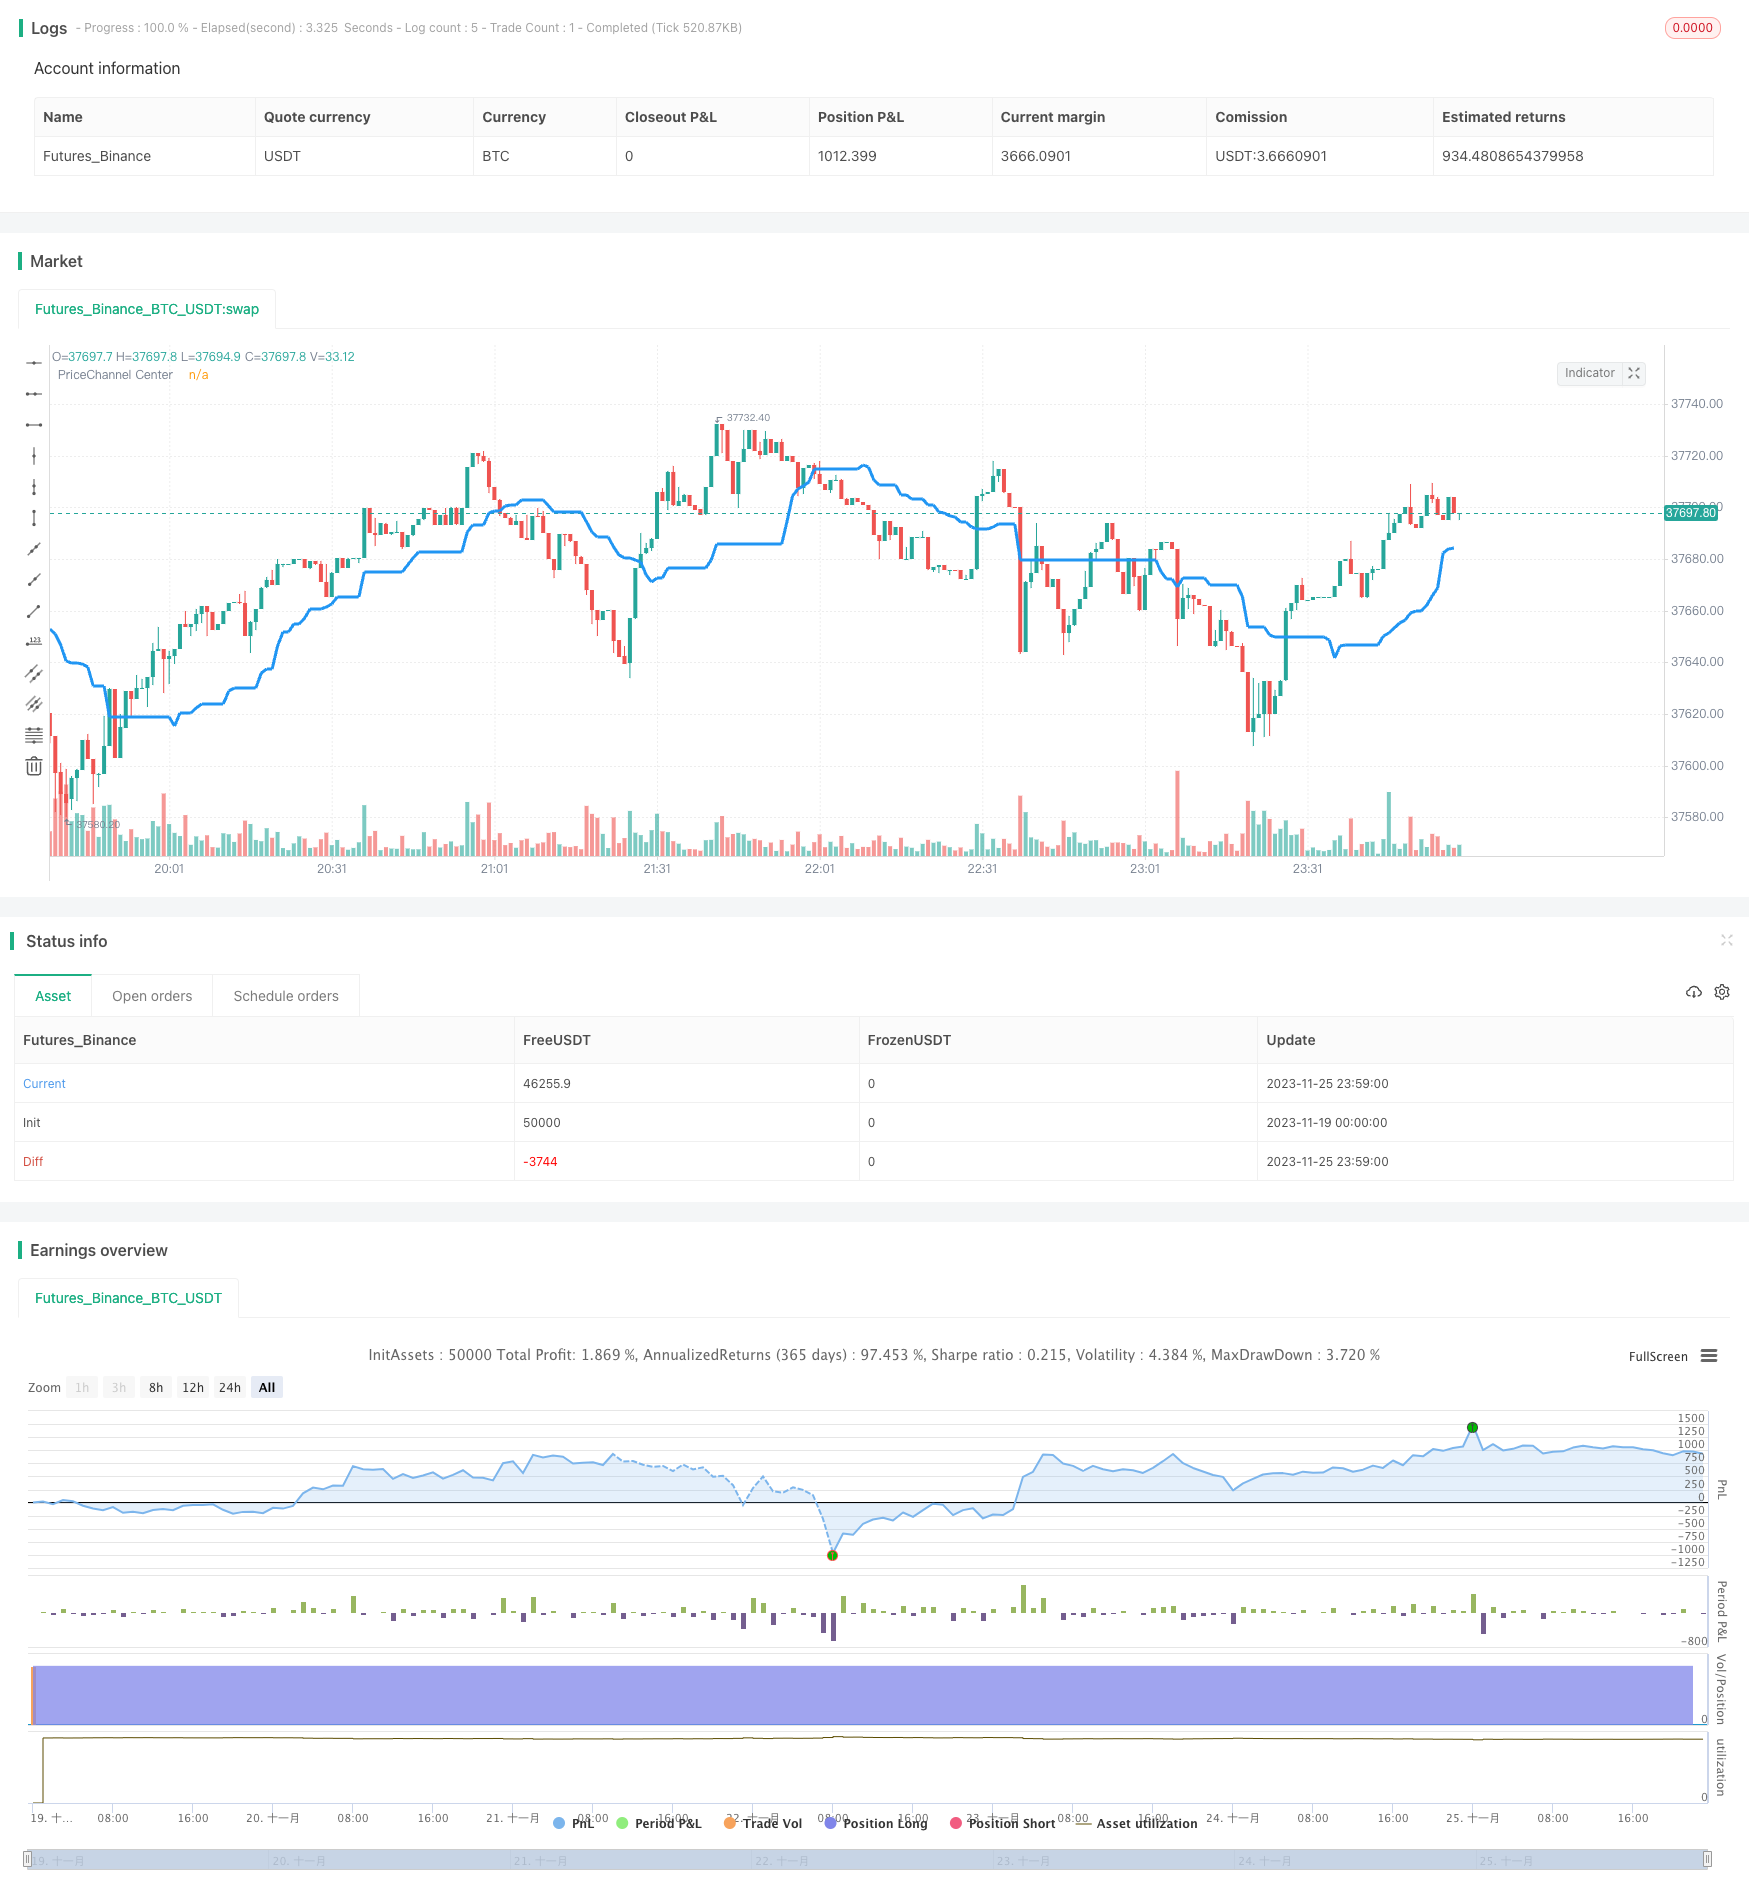
전략 원칙
이 전략의 핵심 지표는 가격 채널 중앙선이다. 계산 방법은 최근 30 K 선의 최고 가격과 최저 가격의 평균을 취하는 것이다. 낮은 지점이 중심선보다 높을 때 상승 추세로 간주하고, 높은 지점이 중심선보다 낮을 때 하락 추세로 간주한다.
전략은 트렌드 배경이 변할 때만 거래 신호를 냅니다. 즉, 상승 배경에서는 K 선이 빨간색으로 변할 때만 공백을 둡니다. 하락 배경에서는 K 선이 녹색으로 변할 때만 더 많은 것을 합니다.
또한, 전략은 이중 필터링 조건을 설정합니다. 개체 필터링과 가격 채널 바 필터링. 개체 부피가 평균의 20% 이상일 때만 신호를 유발합니다. 필터링 사이클 내에 연속적인 트렌드 신호가 있어야 포지션을 열 수 있습니다.
우위 분석
이 전략은 트렌드, 가치 지역, K선 형태를 결합하여 매우 효율적인 역전 거래 전략이다. 주요 장점은 다음과 같다:
- 가격 채널을 사용하여 주요 트렌드를 판단하고, 변동하는 시장에 의해 오해하지 마십시오.
- 가격 통로의 중심선 근처에 위치해 있는 지점은 고전적인 낮은 가격과 높은 가격의 지역이다.
- K선 엔터티와 채널 바스 필터링은 신호 품질을 높이고, 잘못된 신호율을 낮춘다.
- 하지만, 이 거래소에서 거래할 수 있는 가장 좋은 방법은, 명확한 전환점에서만 거래하는 것입니다.
위험과 해결책
이 전략의 주요 위험은 가격 반전 지점을 놓치고 신호를 기다리지 않는 것입니다. 다음과 같은 방법으로 최적화 할 수 있습니다:
- 필터링 조건의 엄격함을 조정하여 필터링 기준을 낮추면 누출률을 줄일 수 있다.
- 트렌드 반전 초기에는 포지션을 늘리고, 트렌드 수익을 추적할 수 있다.
- 다른 지표와 함께 역전 신호 강도를 판단하고, 주관적 간섭 필터링 조건을 다.
최적화 방향
이 전략은 다음과 같은 부분에서 최적화될 수 있습니다.
- 최적화 파라미터, 예를 들어 가격 채널 주기 조정, 채널 바 수 등.
- 손실이 일정 비율에 도달했을 때 손실을 멈추는 전략을 증가시킵니다.
- 거래량과 결합하여, 양이 개입할 수 있는 필터링 조건의 강도. 양이 확대될 수 있을 때 필터링을 느슨하게 한다.
- 단순한 필터를 대신하여 트렌드 회귀 확률을 판단하는 기계 학습 모델을 추가합니다.
요약하다
공간 지향 가격 역전 전략은 가격 통로를 판단하여 역전 시점을 설정하여 듀얼 필터링 조건을 설정하여 고품질의 신호를 생성한다. 파라미터 조정 및 풍선 제어에 기반하여 신뢰할 수있는 양적 전략이다.
/*backtest
start: 2023-11-19 00:00:00
end: 2023-11-26 00:00:00
period: 1m
basePeriod: 1m
exchanges: [{"eid":"Futures_Binance","currency":"BTC_USDT"}]
*/

//Noro
//2018

//@version=2
strategy(title = "Noro's PriceChannel for D1 v1.0", shorttitle = "PriceChannel D1", overlay = true, default_qty_type = strategy.percent_of_equity, default_qty_value = 100.0, pyramiding = 0)

//Settings
needlong = input(true, "long")
needshort = input(true, "short")
slowlen = input(30, defval = 30, minval = 2, maxval = 200, title = "PriceChannel Period")
pcbars = input(1, defval = 1, minval = 1, maxval = 20, title = "PriceChannel Bars")
usecol = input(true, "Use color-filter")
usebod = input(true, "Use body-filter")
needbg = input(false, defval = false, title = "Need trend Background?")
fromyear = input(1900, defval = 1900, minval = 1900, maxval = 2100, title = "From Year")
toyear = input(2100, defval = 2100, minval = 1900, maxval = 2100, title = "To Year")
frommonth = input(01, defval = 01, minval = 01, maxval = 12, title = "From Month")
tomonth = input(12, defval = 12, minval = 01, maxval = 12, title = "To Month")
fromday = input(01, defval = 01, minval = 01, maxval = 31, title = "From day")
today = input(31, defval = 31, minval = 01, maxval = 31, title = "To day")

src = close

//PriceChannel
lasthigh = highest(src, slowlen)
lastlow = lowest(src, slowlen)
center = (lasthigh + lastlow) / 2

//Trend
ub = low > center ? 1 : 0
db = high < center ? 1 : 0
trend = sma(ub, pcbars) == 1 ? 1 : sma(db, pcbars) == 1 ? -1 : trend[1]

//Body
body = abs(close - open)
abody = sma(body, 10)

//Signals
up = trend == 1 and (close < open or usecol == false) and (body > abody / 5 or usebod == false)
dn = trend == -1 and (close > open or usecol == false) and (body > abody / 5 or usebod == false)

//Lines
plot(center, color = blue, linewidth = 3, transp = 0, title = "PriceChannel Center")

//Background
col = needbg == false ? na : trend == 1 ? lime : red
bgcolor(col, transp = 80)

//Trading
if up
    strategy.entry("Long", strategy.long, needlong == false ? 0 : na, when=(time > timestamp(fromyear, frommonth, fromday, 00, 00) and time < timestamp(toyear, tomonth, today, 23, 59)))

if dn
    strategy.entry("Short", strategy.short, needshort == false ? 0 : na, when=(time > timestamp(fromyear, frommonth, fromday, 00, 00) and time < timestamp(toyear, tomonth, today, 23, 59)))

if time > timestamp(toyear, tomonth, today, 23, 59)
    strategy.close_all()