더블 이동 평균 교차 돌파 전략

개요
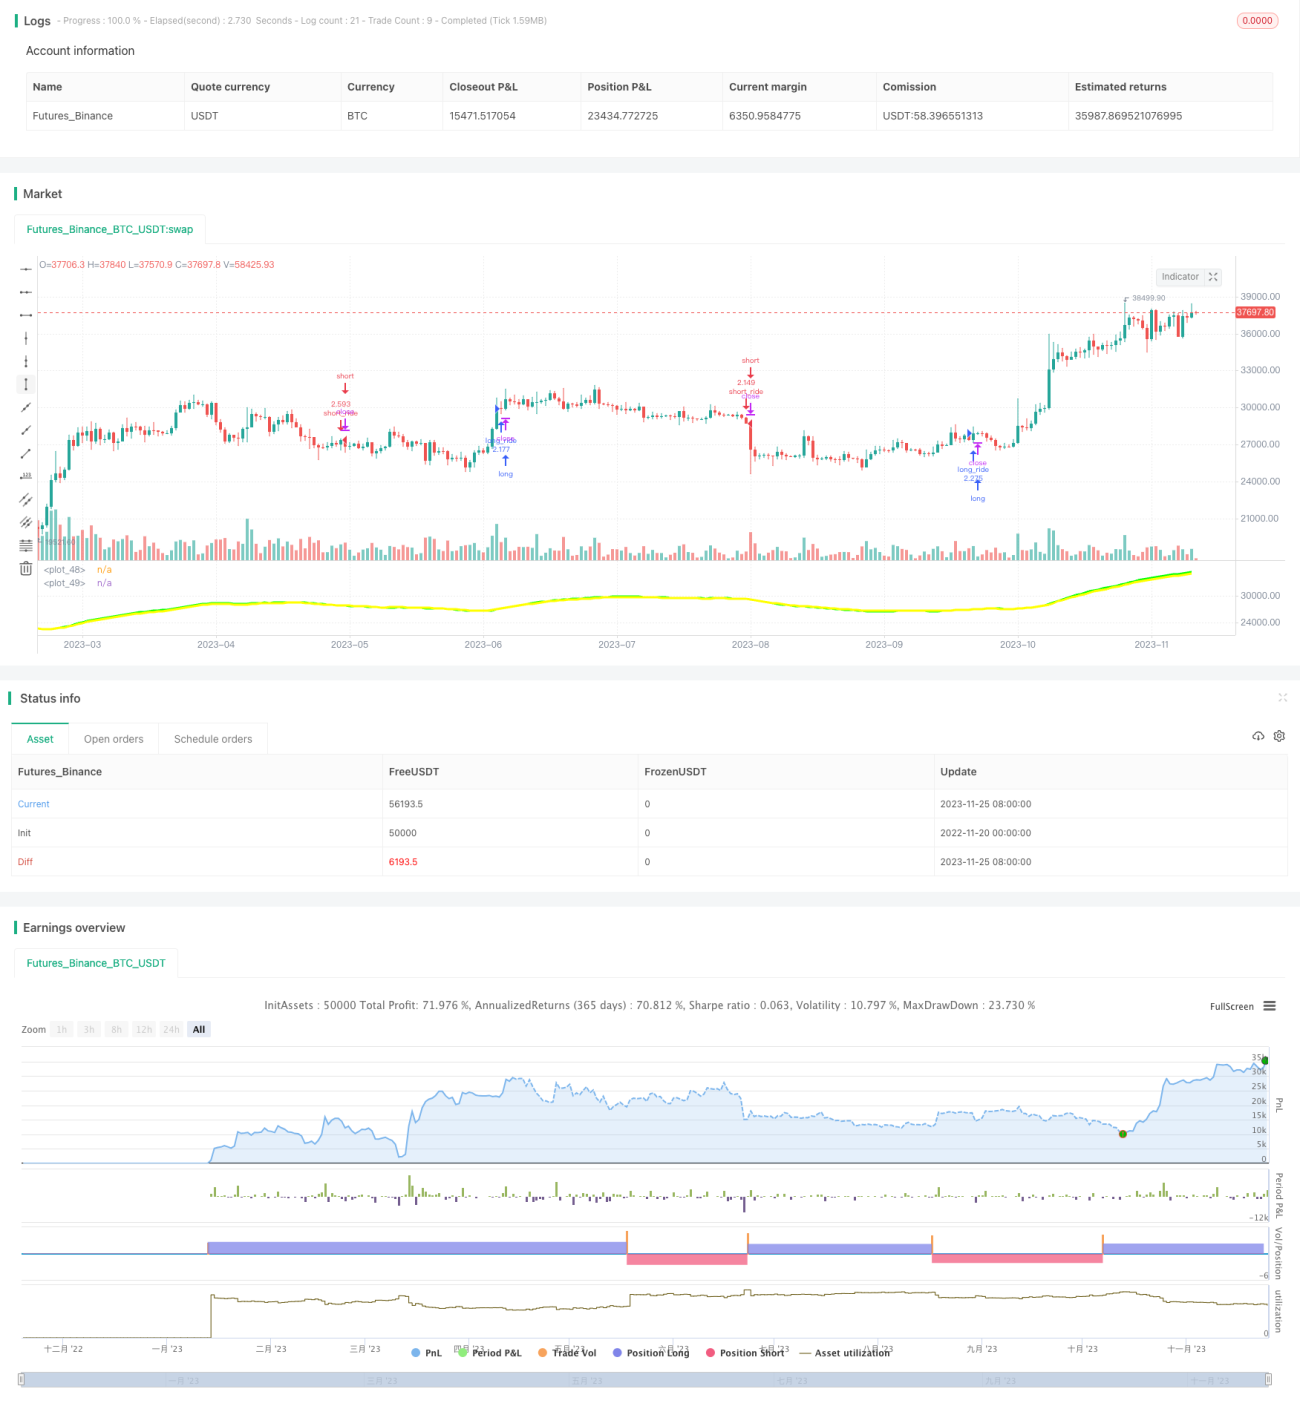
이 전략은 주식의 빠른 30일 간소 이동 평균과 느린 33일 간소 이동 평균을 계산하여 금포크 또는 사각지대가 발생했을 때 LONG 또는 SHORT 입장을 수행합니다. 반대의 신호가 발생했을 때 즉시 중단됩니다. 이것은 트렌드의 변화를 효과적으로 포착 할 수 있습니다.
전략 원칙
이 전략의 핵심은 빠른 30일 평균선과 느린 33일 평균선을 계산하는 것이다. 빠른 선은 가격 변화에 더 빨리 반응하고 느린 선은 더 나은 파동 효과를 갖는다. 빠른 선이 아래에서 느린 선을 뚫고 올라갈 때 구매 신호를 발생시킨다. 이것은 가격이 올라가고 빠른 선이 응답을 하고 있지만 느린 선은 여전히 뒤쳐져 있다는 것을 의미한다. 빠른 선이 위에서 느린 선을 깨고 아래로 내려갈 때 판매 신호를 발생시킨다. 이것은 가격이 내려가고 빠른 선이 응답을 하고 있지만 느린 선은 여전히 뒤쳐져 있다는 것을 의미한다.
이러한 급속한 평평선 교차 디자인을 통해 트렌드 시작 시 거래 신호를 생성하고 반대 신호가 발생 할 때 중지하여 중·장선 가격 트렌드를 효과적으로 포착 할 수 있습니다. 동시에 과도한 시장 변동에 속지 않도록합니다.
우위 분석
이 전략에는 다음과 같은 장점이 있습니다.
- 간단한 이동 평균을 사용해서 이해하기 쉽고 구현하기 쉽습니다.
- 빠른 선과 느린 선의 조합은 가격 변화에 빠르게 반응할 수 있고, 파동효과가 있다.
- 골드 포크와 데드 포크 신호는 간단하고 명확하며 조작이 쉽습니다.
- 중·장기 트렌드를 효과적으로 포착할 수 있습니다.
- 리버스 신호가 발생했을 때 신속한 정지, 위험을 제어할 수 있다
위험 분석
이 전략에는 몇 가지 위험도 있습니다.
- 가격의 흔들림 상태에서 여러 개의 잘못된 신호가 발생할 수 있으며 이는 과도한 거래로 이어질 수 있습니다.
- 급격한 가격 변동에 대응할 수 없는 상황
- 선택된 매개 변수들, 예를 들어 평균선 주기 등은 최적화가 필요할 수 있으며, 부적절한 설정은 정책의 성능에 영향을 미칠 수 있다.
- 거래비용이 수익에 영향을 미칠 수 있습니다.
이러한 위험은 변수 최적화, 스톱로스 설정, 트렌드가 명확할 때만 거래하는 등의 방법으로 제어 및 줄일 수 있습니다.
최적화 방향
이 전략은 다음과 같은 부분에서 최적화될 수 있습니다.
- 평균 주기 및 교차 유형을 최적화하여 최적의 변수 조합을 찾습니다.
- 트레이딩 볼륨, MACD 등과 같은 다른 기술 지표 필터를 추가하여 가짜 신호를 줄이십시오.
- 단순한 역신호 상쇄가 아닌 적응적 상쇄 메커니즘을 추가합니다.
- 다른 상품에 대한 디자인 변수 조합과 상쇄 규칙
- 기계 학습과 같은 방법을 결합하여 동적으로 조정하는 파라미트
테스트와 최적화를 통해 전략 규칙을 지속적으로 개선하여 다양한 시장 환경에서 더 신뢰할 수있는 거래 신호를 얻을 수 있습니다.
요약하다
이 쌍평평선 교차 돌파 전략은 전체적으로 간단하고 실용적이며, 빠른 평평선과 느린 평평선을 결합하여 중장선 트렌드의 시작을 효과적으로 식별하여 신뢰할 수있는 거래 신호를 생성할 수 있습니다. 또한, 그것의 중단 손실 규칙은 구현하기 쉽습니다. 추가적으로 최적화하면 이 전략은 장기적으로 보유할 가치가있는 계량화 시스템으로 될 수 있습니다.
/*backtest
start: 2022-11-20 00:00:00
end: 2023-11-26 00:00:00
period: 1d
basePeriod: 1h
exchanges: [{"eid":"Futures_Binance","currency":"BTC_USDT"}]
*/

//@version=3
//future strategy
//strategy(title = "es1!_1minute_hull", default_qty_type = strategy.fixed, initial_capital=250000,  overlay = true, commission_type=strategy.commission.cash_per_contract,commission_value=2, calc_on_order_fills=false, calc_on_every_tick=false,pyramiding=0)
//strategy.risk.max_position_size(2)- 1