
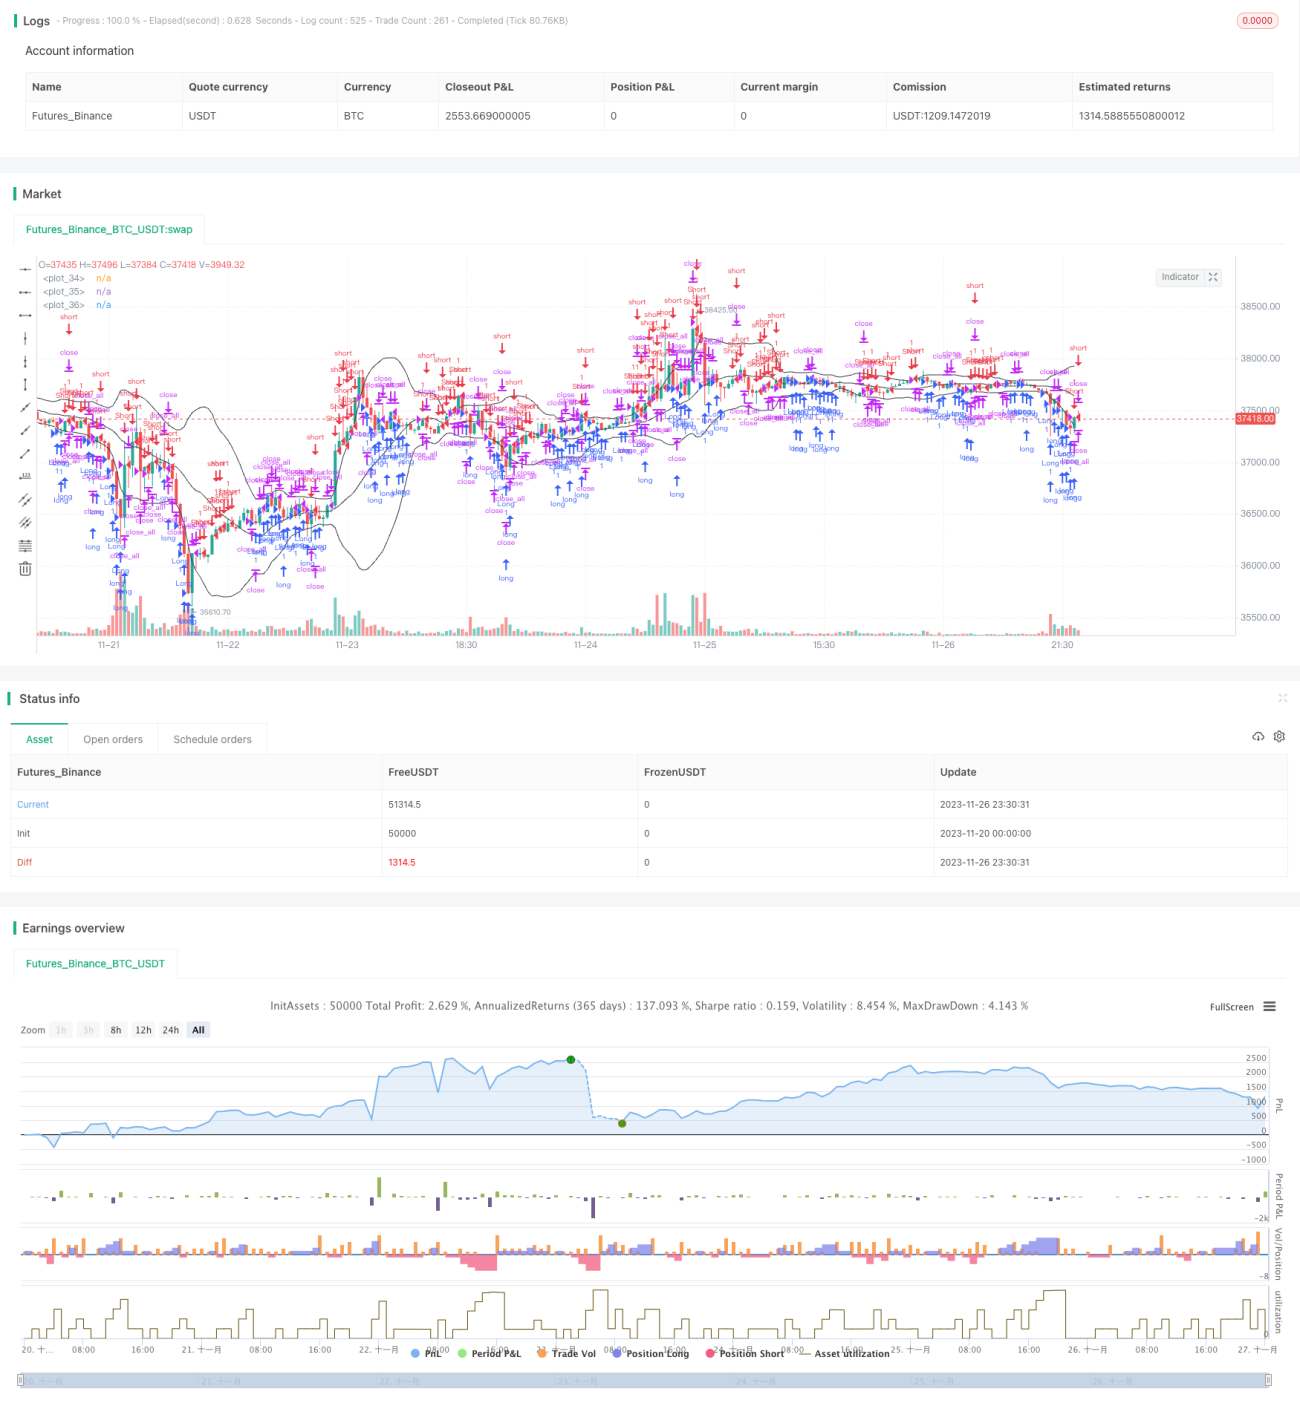
이 전략은 부린밴드 기반의 동적 변동 추적 전략이다. 부린밴드 지표와 결합하여 시장의 추세와 반전점을 판단하고, 다중 공백 포지션을 설정하여 시장의 변동을 추적한다.
이 전략의 핵심 지표는 부린 띠이다. 부린 띠는 중궤도, 상궤도, 하궤도로 구성된다. 중궤도는 n일 이동 평균이며, 상궤도와 하궤도는 각각 중궤도加減 표준차의 편차이다. 가격이 상하궤도에 가까워지면 초매의 신호로 간주된다. 전략은 트렌드 편차를 포지션 구축의 근거로 추가한다. 즉, 가격이 반향하여 중궤도를 돌파 할 때 포지션을 열다.
이 전략은 동시적으로 트렌드 입구 포지션과 반전 입구 포지션을 추가하여 각각 다른 거래 기회에 대응한다. 트렌드 입구 포지션은 중궤도를 지원 저항 레퍼런스로 요구하며, 돌파의 오차 효과를 형성한다. 반전 입구는 부린 벨트 상의 하계 궤도 근처에 직접 반전 형성한다. 이 두 가지 계시를 조합하여 전략은 트렌드 추적과 반전 작업을 병행할 수 있다.
이 전략은 브린띠의 과매매 과매매 특성을 결합하여 반전점 판단을 더한다. 이것은 트렌드 시장과 충격 시장에 동시에 적용될 수 있도록 하며, 다른 유형의 거래 기회를 잡는다. 전략의 중지 손실 Exit 설정은 손실을 확장하는 것을 막는다. 다중 포지션 쌍방향 거래의 특성은 또한 전략의 적용성을 강화한다.
간단한 브린띠 전략에 비해, 이 전략에 포함된 트렌드 논리 판단은 포지션을 구축하는 것을 더 안정화시키면서 동시에 반전 기회를 잡는다. 이것은 신음률을 향상시킨다. 둘째, 다공간 쌍방향 거래는 또한 다른 시장의 거래 기회를 보다 포괄적으로 이용한다.
이 전략은 주로 부린띠의 과매매 과매매 특성에 의존한다. 따라서 가격이 급격하게 변동할 때 부린띠 간격이 계속 증가하여 여러 번의 손실을 초래할 수 있다. 이것은 잠재적인 위험점이다. 또한, 역으로 판단하는 것은 여전히 불확실성과 오류가 있으며, 실패한 입주와 손실을 초래한다.
부린 띠의 무효에 대한 경우, n 일 파라미터를 축소하여 부린 띠를 더 민감하게 만들 수 있다. 또는 그 폭 범위를 줄여서 손실을 초래할 가능성을 줄일 수 있다. 회전 곡선 판단에 대해서는 돌파의 파라미터를 최적화하여 오류를 줄일 수 있다.
이 전략의 최적화 방향은 다음과 같습니다.
이 전략은 브린 밴드 표준 전략에 대한 효과적인 확장 및 최적화를 수행한다. 추가 된 트렌드 오차 판단은 안정성을 높이고 반전 기회를 잘 활용한다. 다중 공백 양방향 거래 및 손실 중지 설정은 또한 전략을 더 튼튼하게 만든다. 매개 변수를 최적화하고 더 많은 필터를 추가함으로써 효과를 더욱 향상시킬 수 있다.
/*backtest
start: 2023-11-20 00:00:00
end: 2023-11-27 00:00:00
period: 30m
basePeriod: 15m
exchanges: [{"eid":"Futures_Binance","currency":"BTC_USDT"}]
*/
//Noro
//2018
//@version=3
strategy("Noro's Bollinger Strategy v1.3", shorttitle = "Bollinger str 1.3", overlay = true, default_qty_type = strategy.percent_of_equity, default_qty_value = 100.0, pyramiding = 5)
//Settings
needlong = input(true, defval = true, title = "Long")
needshort = input(true, defval = true, title = "Short")
length = input(20, defval = 20, minval = 1, maxval = 1000, title = "Bollinger Length")
mult = input(2.0, defval = 2.0, minval = 0.001, maxval = 50, title = "Bollinger Mult")
source = input(ohlc4, defval = ohlc4, title = "Bollinger Source")
uset = input(true, defval = true, title = "Use trend entry")
usect = input(true, defval = true, title = "Use counter-trend entry")
fromyear = input(2018, defval = 2018, minval = 1900, maxval = 2100, title = "From Year")
toyear = input(2100, defval = 2100, minval = 1900, maxval = 2100, title = "To Year")
frommonth = input(01, defval = 01, minval = 01, maxval = 12, title = "From Month")
tomonth = input(12, defval = 12, minval = 01, maxval = 12, title = "To Month")
fromday = input(01, defval = 01, minval = 01, maxval = 31, title = "From day")
today = input(31, defval = 31, minval = 01, maxval = 31, title = "To day")
showbands = input(true, defval = true, title = "Show Bollinger Bands")
//Bollinger Bands
basis = sma(source, length)
dev = mult * stdev(source, length)
upper = basis + dev
lower = basis - dev
//Lines
col = showbands ? black : na
plot(upper, linewidth = 1, color = col)
plot(basis, linewidth = 1, color = col)
plot(lower, linewidth = 1, color = col)
//Body
body = abs(close - open)
abody = ema(body, 30)
//Signals
bar = close > open ? 1 : close < open ? -1 : 0
up1 = bar == -1 and ohlc4 >= basis and ohlc4 < upper and (close < strategy.position_avg_price or strategy.position_size == 0) and uset
dn1 = bar == 1 and ohlc4 <= basis and ohlc4 > lower and (close > strategy.position_avg_price or strategy.position_size == 0) and uset
up2 = close <= lower and usect
dn2 = close >= upper and usect
exit = ((strategy.position_size > 0 and close > open) or (strategy.position_size < 0 and close < open)) and body > abody / 2
//Trading
if up1 or up2
strategy.entry("Long", strategy.long, needlong == false ? 0 : na, when=(time > timestamp(fromyear, frommonth, fromday, 00, 00) and time < timestamp(toyear, tomonth, today, 23, 59)))
if dn1 or dn2
strategy.entry("Short", strategy.short, needshort == false ? 0 : na, when=(time > timestamp(fromyear, frommonth, fromday, 00, 00) and time < timestamp(toyear, tomonth, today, 23, 59)))
if time > timestamp(toyear, tomonth, today, 23, 59) or exit
strategy.close_all()