StochRSI를 기반으로 한 양적 거래 전략

개요
이 전략은 StochRSI 지표에 기반하여 개발되었다. 이 전략은 주로 StochRSI 지표를 사용하여 과매매 상황을 판단하고, RSI 지표와 결합하여 가짜 신호를 필터링하여 StochRSI 지표가 과매매 지역을 표시할 때 공백을하고, 과매매 지역을 표시할 때 더 많이 하고, 수익을 창출한다.
전략 원칙
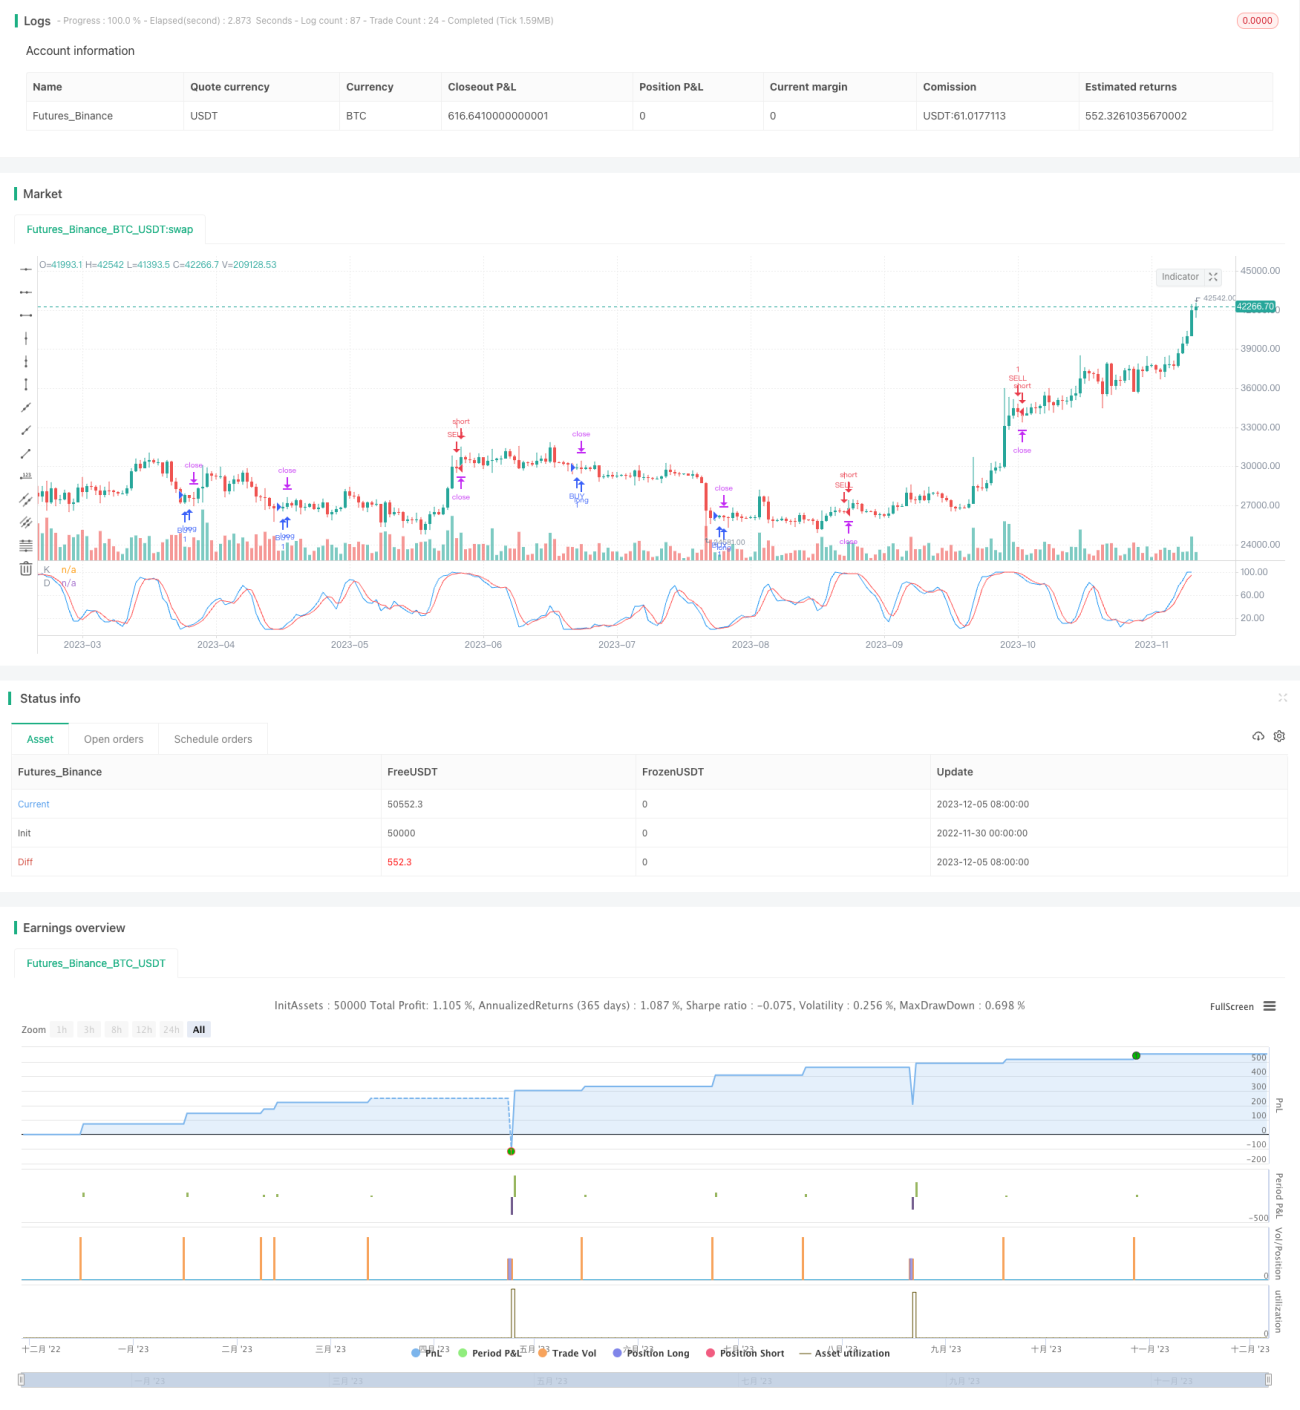
이 전략은 주로 스토흐RSI 지표를 사용하여 시장의 과매매 과매매 지역을 판단한다. 스토흐RSI 지표는 K선과 D선으로 구성되어 있으며, K선은 현재 RSI의 값이 최근 기간 동안의 RSI 가격 범위의 위치를 나타냅니다. D선은 K선의 이동 평균입니다. K선 위에 D선을 통과하면 과매매 지역으로 할 수 있으며, K선 아래에 D선을 통과하면 과매 지역으로 할 수 있습니다.
구체적으로, 전략은 먼저 길이 14의 RSI 지표의 값을 계산하고, RSI 지표에 스토치RSI 지표를 적용한다. 스토치RSI 지표의 파라미터 설정 길이는 14이며, 평평한 주기 K 라인은 3이며, D 라인은 3이다. K 라인 상에서 사용자가 설정한 과매도 영역을 통과할 때 (기본 1) 를 더하고, K 라인 아래에서 사용자가 설정한 과매도 영역을 통과할 때 (기본 99) 를 비워라.
또한, 정책은 중지 손실 및 중지 패러미트를 설정한다. 중지 손실 패러미트는 10000으로 기본 설정된다. 중지 패러미트는 커브 트레일링 스톱으로 설정되어 있으며, 기본 트레일링 포인트는 300이며, 오차는 0이다.
우위 분석
- 스토치RSI를 사용하여 오버 바이 오버 셀 영역을 판단하는 것은 단일 RSI에 비해 더 신뢰할 수 있습니다.
- RSI 필터링 신호와 결합하여 가짜 돌파구를 방지합니다.
- 스톱 손해 차단 메커니즘 제어 위험 설정
위험 분석
- StochRSI 지표에 위조 신호가 있을 가능성이
- 오버 구매 오버 판매 매개 변수를 합리적으로 설정해야 합니다. 그렇지 않으면 잘못된 동작이 발생할 수 있습니다.
- 스톱포인트가 너무 작으면 쉽게 잡힐 수 있고, 스톱포인트가 너무 크면 수익이 제한될 수 있다.
위와 같은 위험을 대비하여 더 긴 매개 변수 주기를 설정하거나 다른 지표 조합과 함께 신호를 필터링하는 것을 고려할 수 있습니다. 과매매 매개 변수를 다른 시장에 맞게 조정하고, 다른 스톱 스톱 매개 변수를 테스트합니다.
최적화 방향
- 가짜 신호를 필터링하기 위해 MACD, 브린 라인 등과 같은 다른 지표 조합과 함께 사용할 수 있습니다.
- 다양한 변수 주기 설정을 테스트하여 더 많은 시장 상황에 적응할 수 있습니다.
- 정지 지점을 최적화하고, 재측정에서 여러 번 테스트하여 최적의 매개 변수를 찾을 수 있습니다.
요약하다
이 전략은 스토치RSI 지표에 기초하여 과매매 지역을 판단하는 거래한다. 단일 RSI 지표에 비해 스토치RSI는 KDJ의 생각을 결합하여 전환점을 더 정확하게 판단 할 수 있다. 또한 RSI 필터링 가짜 신호와 함께 스톱포드 제어 위험을 설정한다. 최적화 공간이 넓고 다른 지표와 함께 사용할 수 있으며 최적화 매개 변수 설정을 할 수 있다.
- 1