양적 거래 정확한 롱 앤 숏 전략

개요
이 글은 주로 부린 채널, ADX 지표와 결합한 K 선을 기반으로 다공평 판단을 하는 양적 거래 전략에 대해 소개한다. 이 전략은 부린 채널을 사용하여 시장 추세와 변동성을 판단하고, ADX 지표와 결합하여 시장 추세가 강하다는 것을 판단하고, 강한 추세 시장 방향에서 더 많은 공백을 하고, 변동적인 상황에서는 전체적인 시선을 바라보고, 최대한 위험을 회피한다.
전략 원칙
-
- 부린 통로의 상하 궤도를 기준으로 시장 추세 방향을 판단한다. 가격은 상하 궤도의 위쪽에 다면 행렬로, 하하 궤도의 아래쪽에 공수 행렬로 있다.
-
- 부린 통로의 대역폭은 시장의 변동성과 위험을 반영한다. 부린 대역폭이 넓으면 시장이 흔들릴수록 위험도가 커서 입장을 피해야 한다.
-
- ADX 지표는 시장 추세가 강하거나 약하다는 것을 판단한다. ADX 값이 25보다 크면 트렌드 상황을 나타냅니다. 이 때 부린 통로 방향이 포지션을 선택하는 방향을 판단한다. ADX 값이 25보다 작으면 흔들림 상황을 나타냅니다. 이 때 거래를 피해야합니다.
-
- 더 많은 상장 방향을 결정한 후, ATR 지표에 따라 중지 손실을 설정합니다. ATR은 시장의 변동성을 측정하는 데 사용되며, ATR 배수에 따라 중지 손실 거리를 설정합니다.
-
- 스톱은 브린 상하철에 따라 설정한다. 다중머리 스톱은 하하철, 빈머리 스톱은 상하철이다. 또는 ATR 지표의 ATR 배수에 따라 고정 스톱 거리를 설정한다.
-
- 스톱로스 위치와 스톱로스 위치 사이에 손익과 손실을 관리하고, 수익을 잠금하기 위해 이동 스톱을 설정한다.
전략적 이점
-
부린 통로와 ADX 지표 판단 방향과 결합하여, 과잉 공백을 명확하게 판단하고 선택적으로 입장을 수립하여, 변동적인 상황에서 무의미한 거래를 피한다.
-
부린 대역폭을 사용하여 변동률 위험을 판단합니다. 부린 대역폭이 좁아지면 기회가 높지만 위험도 적습니다. 부린 대역폭이 넓어지면 거래를 피하십시오.
-
ATR 제약 설정은 위험을 통제할 수 있도록 하고, 제약이 쫓겨나지는 것을 최대한 방지한다.
-
부린 통로 설정에 따라 정지 포지션, 정지 포지션 추격 고 정지 포지션 추격 하위 위험이 없습니다.
-
모바일 스톱은 수익을 확보하고 트렌드를 계속 추적하는 데 도움이 됩니다.
전략적 위험
-
부린 통로와 ADX 지표는 모두 압력이 있을 가능성이 있다. 만약 이탈이 발생하면 잘못된 판단이 발생할 수 있다.
-
ATR 지표는 단지 역사적 변동만을 반영하고 미래의 변동을 예측할 수 없습니다. 실제 정지 손실이 따라 잡힐 위험이 여전히 존재합니다.
-
부린 통로 지역 구분은 주관적이며, 기회를 놓칠 수 있는 상황이 발생할 수 있다.
-
이동 상쇄는 디스크에서만 가능하며, 간격 기간 동안 이동할 수 없는 위험이 있다.
-
재검토 데이터 적합성 위험. 실제 시장에서 테스트 보고서를 복제하기 어렵다.
전략 최적화
-
부린 채널과 ADX 지표의 잘못된 신호를 방지하기 위해 더 많은 지표를 통합하여 상호 신뢰하십시오.
-
ATR 중지에는 점프 중지도 추가할 수 있다. 또는 딥러닝 알고리즘을 사용하여 시장 변동 설정을 중지할 수 있다.
-
부린 통로의 통로 매개 변수를 최적화하여 더 큰 시장 기회를 포용할 수 있도록 합니다.
-
더 효율적인 프로그램 거래 시스템을 사용하여 무인 무인 이동 중지.
-
더 긴 시간 주기 및 더 많은 품종 조합으로 재검토하여 전략의 안정성을 보장하십시오.
요약하다
이 전략은 부린 채널, ADX 지표와 같은 여러 지표 신호를 통합하고, 명확한 트렌드 방향을 판단한 후 선택적 입장을 취하고, ATR 지표를 사용하여 손실 중지 설정을 최적화하고, 위험과 수익률을 최대한 제어하는 것이 권장되는 양적 거래 전략입니다. 우리는 이 전략에 대해 많은 최적화 할 수있는 공간이 있으며, 향후 <unk> 버전의 출력을 기대합니다.
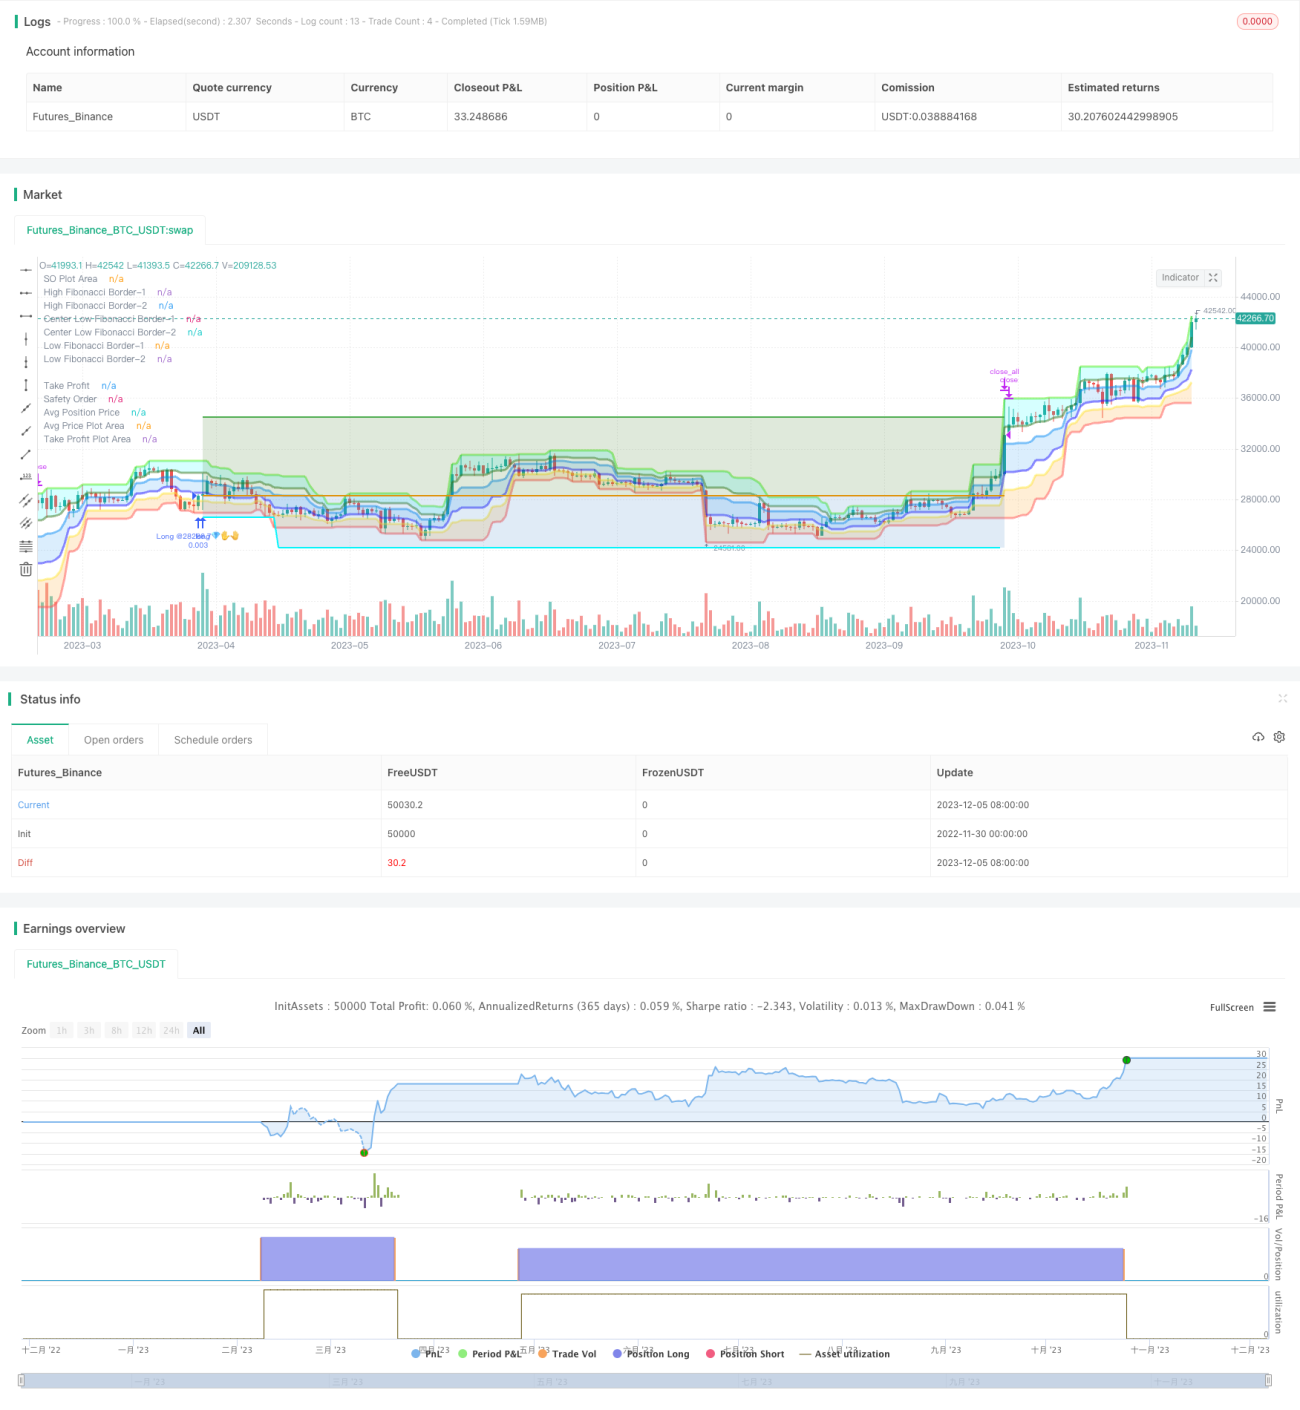
/*backtest
start: 2022-11-30 00:00:00
end: 2023-12-06 00:00:00
period: 1d
basePeriod: 1h
exchanges: [{"eid":"Futures_Binance","currency":"BTC_USDT"}]
*/

// © Fibonacci Zone DCA Strategy - R3c0nTrader ver 2022-06-12
// For backtesting with 3Commas DCA Bot settings
// Thank you "eykpunter" for granting me permission to use "Fibonacci Zones" to create this strategy
// Thank you "junyou0424" for granting me permission to use "DCA Bot with SuperTrend Emulator" which I used for adding bot inputs, calculations, and strategy- 1