RSI 추세 추종 트레일링 스톱 전략


생성 날짜: 2023-12-08 11:41:31 마지막으로 수정됨: 2023-12-08 11:41:31
복사: 3 클릭수: 722
avatar of ChaoZhang ChaoZhang
1
집중하다
1621
수행원

RSI 추세 추종 트레일링 스톱 전략

개요

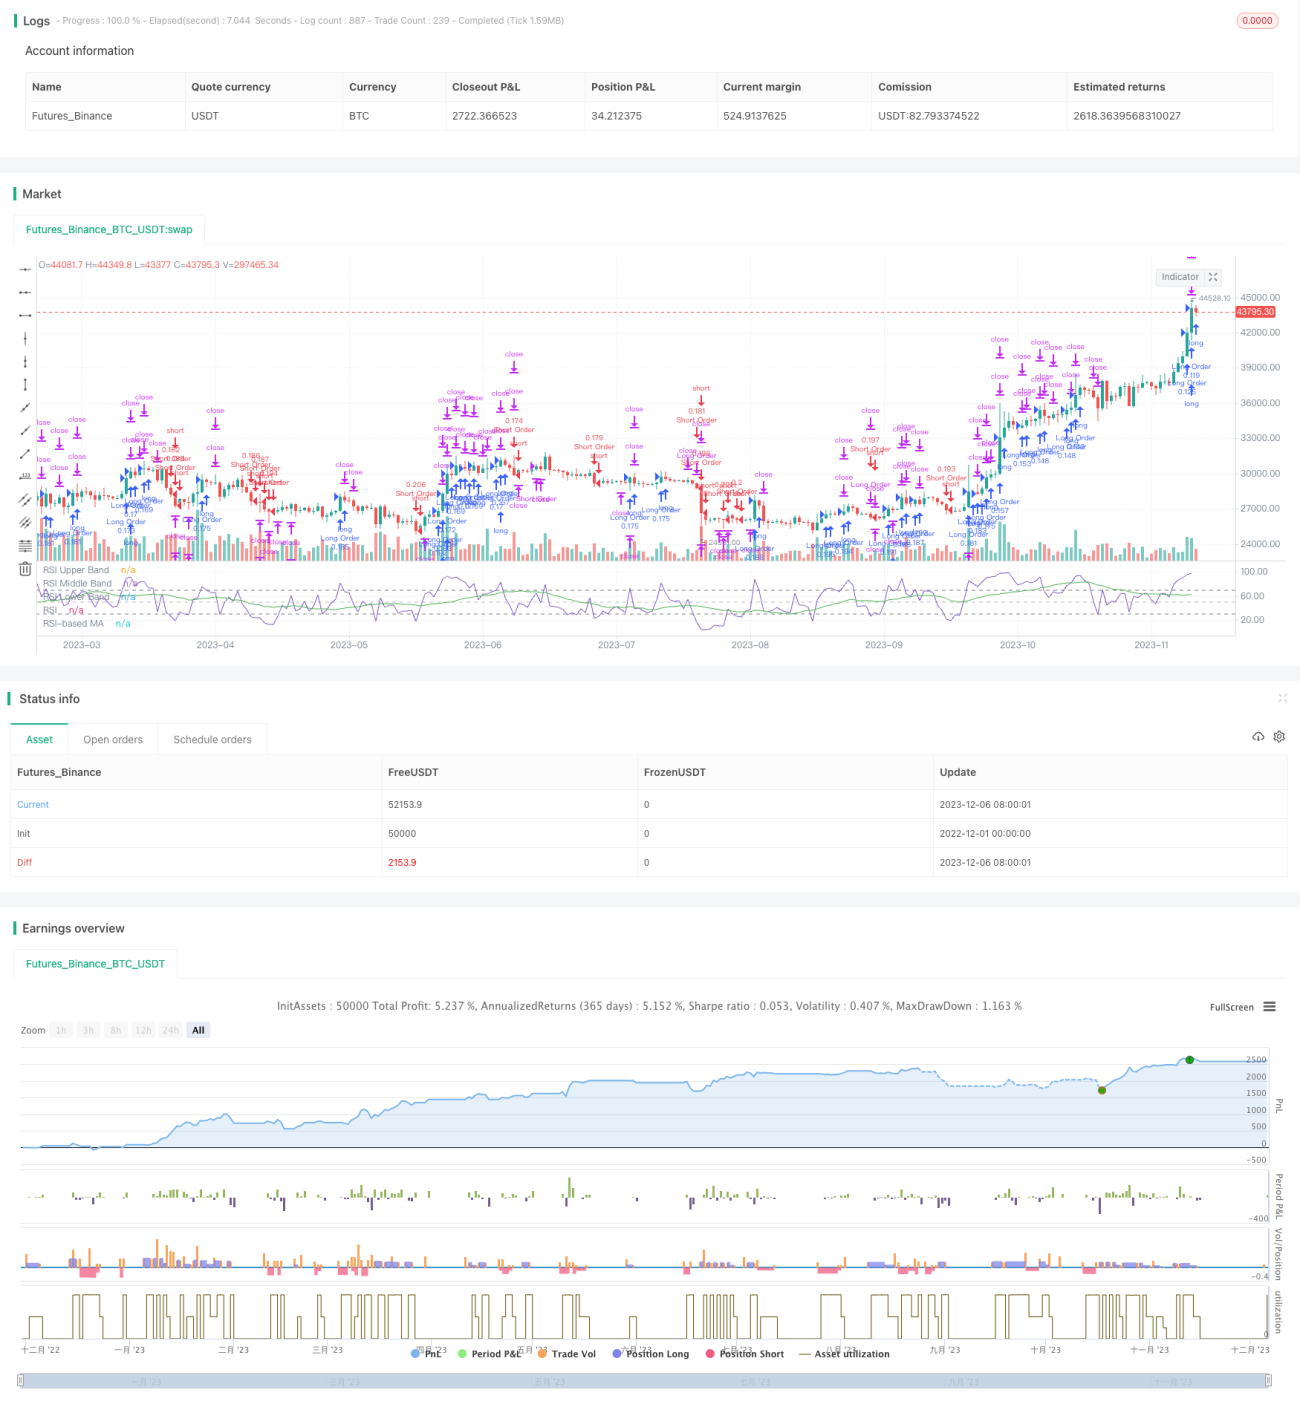
이 전략은 RSI 지표가 트렌드를 식별하고 이동 평균과 결합하여 트렌드 확인을 수행하는 자동 거래 전략이며, 스톱 로스를 설정합니다. RSI가 68보다 크면 이동 평균이 현재 이동 평균을 넘기 전에 더 많이하고, RSI가 28보다 작고 이동 평균이 현재 이동 평균을 넘기기 전에 더 많이하고, 공백합니다. 동시에 스톱 로스를 설정합니다.

전략 원칙

이 전략은 주로 RSI 지표를 사용하여 오버 바이 오버 소드 현상을 파악합니다. RSI가 70보다 크면 오버 바이 지역이며, 30보다 작으면 오버 소드 지역입니다. 이동 평균과 결합 된 황금 십자가와 죽음의 십자가를 사용하여 트렌드를 확인합니다. 구체적인 거래 신호는 다음과 같습니다.

다중 신호: RSI가 68보다 크며 현재 이동 평균에 이동 평균을 통과하기 전에 이동 평균을 통과합니다. 공백 신호: RSI가 28보다 작고 현재 이동 평균 아래로 이동 평균을 뚫기 전에 공백한다.

스톱 스톱 설정은 각 포인트에 대해 다른 스톱 스톱 비율을 설정합니다. 더 느슨한 것에서 더 엄격한 것, 구체적으로:

다중 헤드 스티핑: 1.4%의 하위 스티핑은 절반의 포지션을 중지하고, 0.8%의 하위 스티핑은 전체 포지션을 종료한다. 다자리 스톱: 입장료의 2%를 스톱으로 설정한다.

공백 정지: 낮은 지점에서 0.4% 정지 반 포지션, 낮은 지점에서 0.8% 정지 전체 평지 포지션.
빈 머리 막대기: 입점 가격의 2%를 설정한 막대기.

동시 동향이 반전될 때, 예를 들어, RSI가 30을 넘으면 시장 가격이 완전히 평행된다. RSI가 60을 넘으면 시장 가격이 완전히 평행된다.

전략적 이점

  1. RSI를 사용하여 과매매 현상을 판단하고, 하락을 추적하는 것을 피하십시오.
  2. 이동 평균은 트렌드 필터링을 통해 비주류 방향의 조작을 줄여줍니다.
  3. 이 모든 것은 수익을 극대화하기 위해 진행중인 막대를 설정하는 것입니다.
  4. 트렌드에 적절한 공간을 부여하기 위해 더 높은 스톱포인트를 설정하십시오.
  5. 트렌드 전환 지표의 반전 청산 전략과 함께 급격한 사건에 신속하게 대응한다.

전략적 위험

  1. RSI 파라미터 설정 문제로 인해 인식 효과가 좋지 않습니다.
  2. 이동 평균 변수 설정 문제로 인해 필러링 효과가 좋지 않습니다.
  3. 하지만, 이 경우, 이 경우, 이 경우, 이 경우, 이 경우.
  4. 하지만, 이 모든 것은, 이 모든 것은, 이 모든 것은, 이 모든 것은, 이 모든 것은.
  5. 반전 청산 전략은 잘못된 판단으로 불필요한 손실을 초래한다.

위의 위험을 위해, 변수는 여러 번 테스트하여 최적화해야 한다. 스톱로스 설정은 적절하고, 일정 범위의 완화를 하고, 시장의 변동성에 따라 변수를 조정해야 한다. 청산 전략은 신중해야 하며, 지표의 잘못된 판단으로 손실을 초래하는 것을 피해야 한다.

최적화 방향

다음의 몇 가지 측면에서 더 최적화할 수 있습니다.

  1. 더 많은 파 지표를 추가하여 신호 정확도를 향상시킵니다. 예를 들어 거래량 필터를 추가합니다.
  2. 스톱로드 전략을 조정하고, 최고 가격과 최저 가격을 추적하고, 이동 스톱로드를 구현합니다.
  3. 일부 스톱을 트래킹 스톱으로 조정하여 수익을 극대화하십시오.
  4. 데이터 소스 전환, 다른 품종이 다른 주기를 사용하는 등의 파라미터 조합을 추가한다.
  5. 미래에셋 비상장 보유 비용 고려를 증가시키고, 역동적으로 손해 중지 을 조정한다.

요약하다

이 전략은 전체적으로 보다 성숙한 신뢰할 수 있는 트렌드 추적 전략이다. RSI를 이용하여 과매매 현상을 판단하여 거래 방향을 결정한다. 이동 평균을 사용하여 파동 확인한다. 동시에 적절한 스톱로스 및 진행 스톱을 설정한다. 트렌드에서 더 나은 수익을 얻을 수 있다.

전략 소스 코드
// © CRabbit
//@version=5

// Starting with $100 and using 10% of the account per trade
strategy("RSI Template", shorttitle="RSI", overlay=false, initial_capital=100, default_qty_value=10, default_qty_type=strategy.percent_of_equity)

// RSI Indicator
ma(source, length, type) =>
    switch type
        "SMA" => ta.sma(source, length)
        "Bollinger Bands" => ta.sma(source, length)
        "EMA" => ta.ema(source, length)
        "SMMA (RMA)" => ta.rma(source, length)
        "WMA" => ta.wma(source, length)
        "VWMA" => ta.vwma(source, length)

rsiLengthInput = input.int(4, minval=1, title="RSI Length", group="RSI Settings")
rsiSourceInput = input.source(close, "Source", group="RSI Settings")
maTypeInput = input.string("SMA", title="MA Type", options=["SMA", "Bollinger Bands", "EMA", "SMMA (RMA)", "WMA", "VWMA"], group="MA Settings")
maLengthInput = input.int(23, title="MA Length", group="MA Settings")
bbMultInput = input.float(2.0, minval=0.001, maxval=50, title="BB StdDev", group="MA Settings")

up = ta.rma(math.max(ta.change(rsiSourceInput), 0), rsiLengthInput)
down = ta.rma(-math.min(ta.change(rsiSourceInput), 0), rsiLengthInput)
rsi = down == 0 ? 100 : up == 0 ? 0 : 100 - (100 / (1 + up / down))
rsiMA = ma(rsi, maLengthInput, maTypeInput)
isBB = maTypeInput == "Bollinger Bands"

plot(rsi, "RSI", color=#7E57C2)
plot(rsiMA, "RSI-based MA", color=color.green)
rsiUpperBand = hline(70, "RSI Upper Band", color=#787B86)
hline(50, "RSI Middle Band", color=color.new(#787B86, 50))
rsiLowerBand = hline(30, "RSI Lower Band", color=#787B86)
fill(rsiUpperBand, rsiLowerBand, color=color.rgb(126, 87, 194, 90), title="RSI Background Fill")


// Configure backtest start date with inputs
startDate = input.int(title="Start Date", defval=1, minval=1, maxval=31)
startMonth = input.int(title="Start Month", defval=6, minval=1, maxval=12)
startYear = input.int(title="Start Year", defval=2022, minval=1800, maxval=2100)

// See if this bar's time happened on/after start date
afterStartDate = (time >= timestamp(syminfo.timezone,
     startYear, startMonth, startDate, 0, 0))


// Long and Short buy strategy
// Submit a market open/ close Long order, but only on/after start date
if (afterStartDate)
    if rsi > 68 and (rsiMA > rsiMA[1])
        strategy.entry("Long Order", strategy.long, comment="ENTER-LONG")
    if rsi < 30
        strategy.close("Long Order", alert_message="L-CL")

strategy.exit("L-TP1", from_entry="Long Order", limit=high * 1.004, qty_percent=50, alert_message="L-TP1" + str.tostring(high * 1.004))
strategy.exit("L-TP2", from_entry="Long Order", limit=high * 1.008, qty_percent=100, alert_message="L-TP2" + str.tostring(high * 1.008))
strategy.exit("Exit Long", from_entry="Long Order", stop=low * 0.98, alert_message="L-SL" + str.tostring(low * 0.98))        


// Submit a market Open/ Close Short order, but only on/after start date
if (afterStartDate)
    if rsi < 28 and (rsiMA < rsiMA[1])
        strategy.entry("Short Order", strategy.short, comment="ENTER-SHORT")
    if rsi > 60
        strategy.close("Short Order", alert_message="S-CL")    

strategy.exit("S-TP1", from_entry="Short Order", limit=low * 0.996, qty_percent=50, alert_message="S-TP1" + str.tostring(low * 0.996))
strategy.exit("S-TP2", from_entry="Short Order", limit=low * 0.992, qty_percent=100, alert_message="S-TP2" + str.tostring(low * 0.992))
strategy.exit("Exit Short", from_entry="Short Order", stop=high * 1.02, alert_message="S-SL" + str.tostring(high * 1.02))

// MONTHLY TABLE //

prec      = input(2, title = "Return Precision")

new_month = month(time) != month(time[1])
new_year  = year(time)  != year(time[1])

eq = strategy.equity

bar_pnl = eq / eq[1] - 1

cur_month_pnl = 0.0
cur_year_pnl  = 0.0

// Current Monthly P&L
cur_month_pnl := new_month ? 0.0 : 
                 (1 + cur_month_pnl[1]) * (1 + bar_pnl) - 1 

// Current Yearly P&L
cur_year_pnl := new_year ? 0.0 : 
                 (1 + cur_year_pnl[1]) * (1 + bar_pnl) - 1  

// Arrays to store Yearly and Monthly P&Ls
var month_pnl  = array.new_float(0)
var month_time = array.new_int(0)

var year_pnl  = array.new_float(0)
var year_time = array.new_int(0)

if (not na(cur_month_pnl[1]) and (new_month or barstate.islast))
    array.push(month_pnl , cur_month_pnl[1])
    array.push(month_time, time[1])

if (not na(cur_year_pnl[1]) and (new_year or barstate.islast))
    array.push(year_pnl , cur_year_pnl[1])
    array.push(year_time, time[1])

// Monthly P&L Table    
var monthly_table = table(na)

if (barstate.islast)
    monthly_table := table.new(position.bottom_right, columns = 14, rows = array.size(year_pnl) + 1, border_width = 1)

    table.cell(monthly_table, 0,  0, "",     bgcolor = #cccccc)
    table.cell(monthly_table, 1,  0, "Jan",  bgcolor = #cccccc)
    table.cell(monthly_table, 2,  0, "Feb",  bgcolor = #cccccc)
    table.cell(monthly_table, 3,  0, "Mar",  bgcolor = #cccccc)
    table.cell(monthly_table, 4,  0, "Apr",  bgcolor = #cccccc)
    table.cell(monthly_table, 5,  0, "May",  bgcolor = #cccccc)
    table.cell(monthly_table, 6,  0, "Jun",  bgcolor = #cccccc)
    table.cell(monthly_table, 7,  0, "Jul",  bgcolor = #cccccc)
    table.cell(monthly_table, 8,  0, "Aug",  bgcolor = #cccccc)
    table.cell(monthly_table, 9,  0, "Sep",  bgcolor = #cccccc)
    table.cell(monthly_table, 10, 0, "Oct",  bgcolor = #cccccc)
    table.cell(monthly_table, 11, 0, "Nov",  bgcolor = #cccccc)
    table.cell(monthly_table, 12, 0, "Dec",  bgcolor = #cccccc)
    table.cell(monthly_table, 13, 0, "Year", bgcolor = #999999)


    for yi = 0 to array.size(year_pnl) - 1
        table.cell(monthly_table, 0,  yi + 1, str.tostring(year(array.get(year_time, yi))), bgcolor = #cccccc)
        
        y_color = array.get(year_pnl, yi) > 0 ? color.new(color.green, transp = 50) : color.new(color.red, transp = 50)
        table.cell(monthly_table, 13, yi + 1, str.tostring(math.round(array.get(year_pnl, yi) * 100, prec)), bgcolor = y_color)
        
    for mi = 0 to array.size(month_time) - 1
        m_row   = year(array.get(month_time, mi))  - year(array.get(year_time, 0)) + 1
        m_col   = month(array.get(month_time, mi)) 
        m_color = array.get(month_pnl, mi) > 0 ? color.new(color.green, transp = 70) : color.new(color.red, transp = 70)
        
        table.cell(monthly_table, m_col, m_row, str.tostring(math.round(array.get(month_pnl, mi) * 100, prec)), bgcolor = m_color)