더블 이동 평균 볼린저 밴드 추세 추종 전략

개요
이 전략은 2개의 다른 주기들의 지수 이동 평균 ((EMA) 을 계산하여 시장의 경향 방향을 판단하고, 경향 방향이 결정된 것을 전제로, 부린에 대한 자조와 결합하여 과매매 기회를 발견하고, 트렌드 추적 거래를 실현한다.
전략 원칙
-
200주기 및 30주기 EMA를 계산하고, 200EMA가 30EMA보다 크면 긴 선의 상승으로 판단하고, 그렇지 않으면 긴 선의 하향으로 판단한다.
-
트렌드 방향을 결정한 후, 브린 밴드의 기본선, 상단선 및 하단선을 계산한다. 기본선은 구성 가능한 주기 (예: 8주기) 를 사용하는 SMA를 계산하고, 폭은 동일한 주기 (예: 1.3과 1.1) 의 최고 가격과 최저 가격의 극한의 구성 가능한 배수를 사용합니다.
-
긴 선 위쪽에서는 가격이 아래쪽에서 위쪽으로 하차할 때 구매점으로 판단하고, 긴 선 아래쪽에서는 가격이 위쪽에서 아래쪽으로 하차할 때 판매점으로 판단한다.
-
가짜 돌파를 필터링하기 위해, 돌파가 발생했을 때 전 K 선의 변화율이 설정 가능한 값 (예: 3%) 보다 작는지 확인하고, 부린 벨트 상하 궤도 간격이 설정 가능한 거리 (예: 2.2%) 보다 크는지 확인한다.
-
포지션을 개시한 후 설정할 수 있는 스톱로스 (예: 3%) 와 스톱<unk> (예: 10%) 를 설정하여 수익을 고정한다.
전략적 이점
-
이중 EMA는 주 트렌드를 판단하여 주 트렌드가 불분명할 때 무질서하게 포지션을 개설하는 것을 피한다.
-
적응형 부린 띠는 개시점을 설정하고, 트렌드에 따라 자동으로 대역폭 파라미터를 조정하여 추세를 더욱 고정합니다.
-
변동률과 최소 대역폭 검사 메커니즘은 가짜 돌파구를 효과적으로 필터링한다.
-
상쇄장치 설정이 합리적이고, 수익을 고정하는 위험도 조절할 수 있다.
전략적 위험
-
이중 EMA는 전환점을 정확하게 판단하지 못하여 트렌드 전환 기회를 놓칠 수 있습니다.
-
부린 밴드 파라미터를 잘못 설정하면 가짜 신호가 발생할 수 있다.
-
고정된 스피드 스<unk>은 시장의 변동에 적응하기 힘들다.
최적화 방향
-
다른 지표와 함께 추세를 판단하여 주요 트렌드 전환점을 결정한다.
-
브린 대역변수를 동적으로 조정하는 방법을 사용한다.
-
조건형 단발<unk> 스톱 손실을 설정하고, 특정 조건에 따라 스톱 라인을 조정한다.
요약하다
이 전략은 쌍 EMA 판단 주 트렌드 및 부린 밴드 발견 기회의 방법을 통합하여 트렌드 추적 거래를 구현합니다. 전략의 장점은 합리적으로 개시 및 중지 조건을 설정하여 트렌드 수익을 효과적으로 잠금 할 수 있습니다. 또한 전환점을 판단 할 수 없는 것과 부린 밴드 파라미터를 부적절하게 설정하는 것과 같은 위험이 있습니다. 이러한 문제에는 더 나은 최적화 공간이 있으며, 전략이 트렌드 수익을 더 잘 파악 할 수 있습니다.
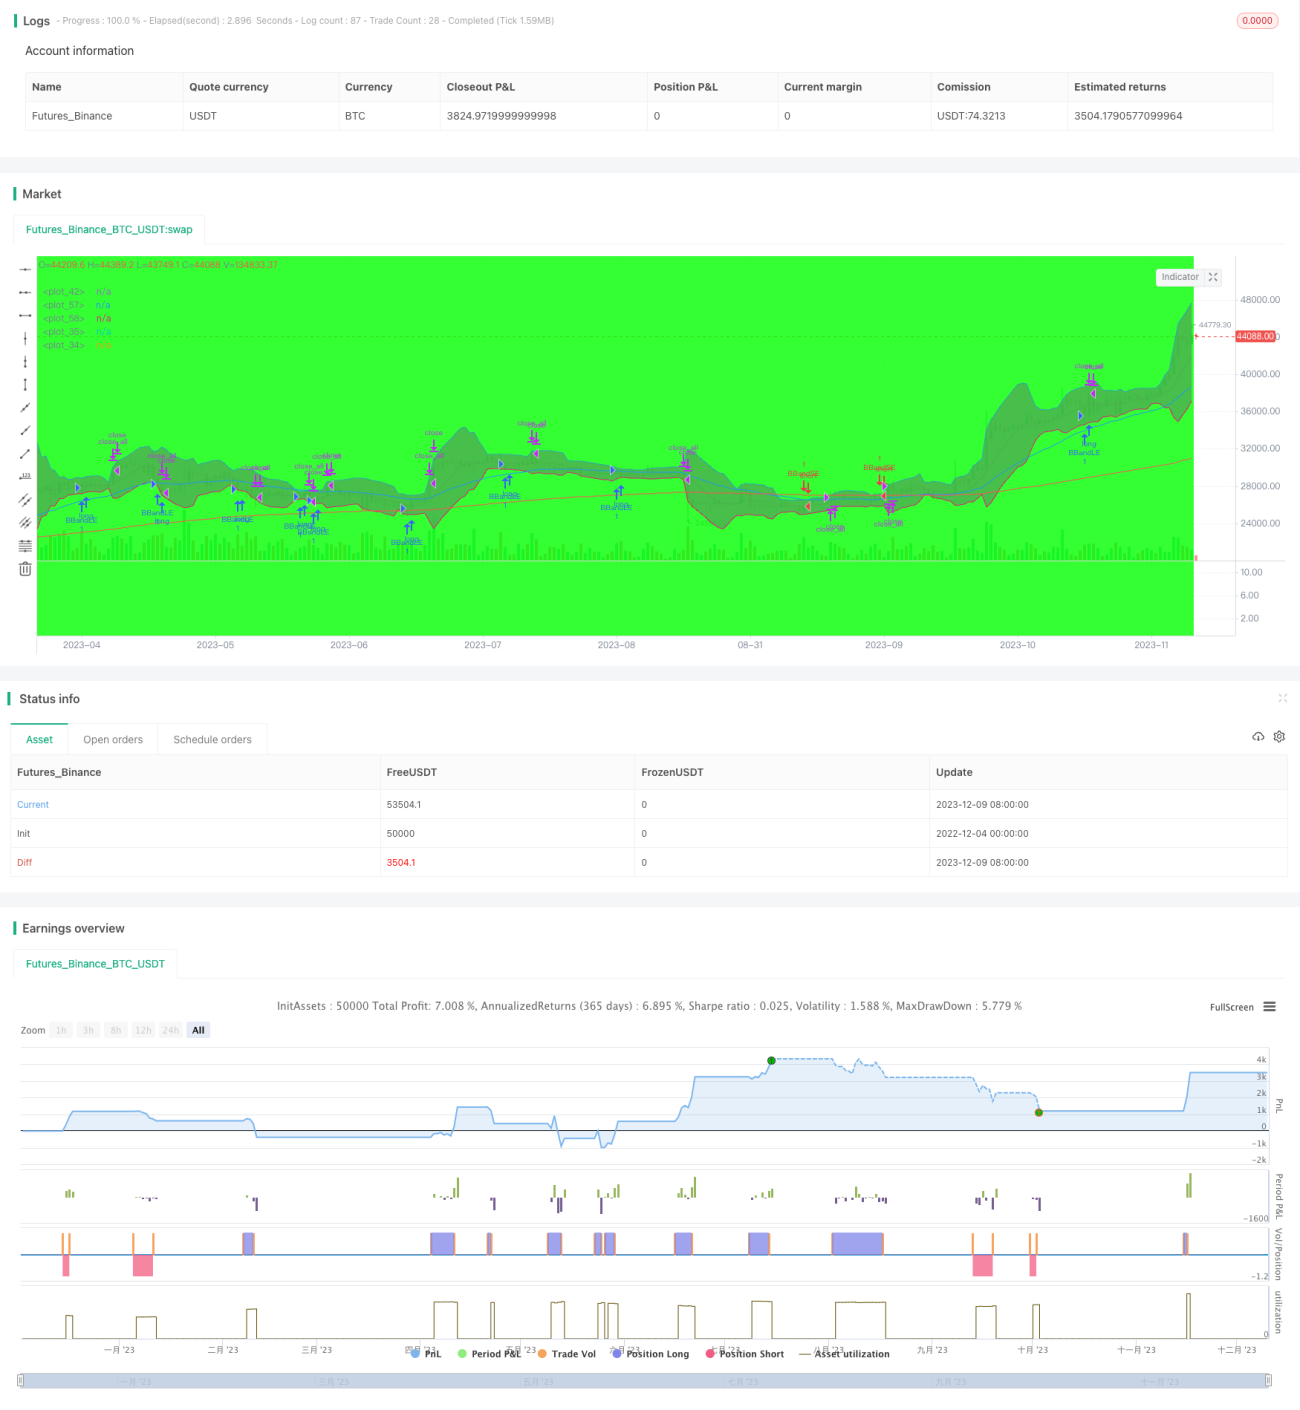
/*backtest
start: 2022-12-04 00:00:00
end: 2023-12-10 00:00:00
period: 1d
basePeriod: 1h
exchanges: [{"eid":"Futures_Binance","currency":"BTC_USDT"}]
*/

//@version=3
//////////////////////////////////////////////////////////////////////
// Component Code Start
testStartYear = input(2019, "Backtest Start Year")- 1