
다인자 조합 자기 적응 이동 평균 전략은 일일선, 이동 평균, 집적 크로스 및 HA 평균선을 동시에 사용하는 복합 전략이다. 이 전략은 더 많은 거래 기회를 탐색하여 황소 시장에서 더 높은 누적 수익을 얻으려는 것이다.
이 전략의 핵심 논리는 여러 기술 지표가 결합되어 구매/판매 신호에 점수를 부여하고, 서로 다른 요소의 일치 결과에 따라 서로 다른 강도의 거래 신호를 제공하는 것이다.
특히, 전략에 사용되는 네 가지 주요 기술 지표는 다음과 같습니다.
일내선 ᆞ 전략은 일내선의 색을 사용하여 가격 흐름을 판단합니다. 연속적으로 두 개의 녹색 개체 HA 평균선은 구매 신호이며, 연속적으로 두 개의 빨간 공백 HA 평균선은 공백 신호입니다.
이동 평균. 전략은 동시에 빠른, 느린, 필터링 세 개의 다른 파라미터 설정을 사용하는 이동 평균. 빠른 라인이 느린 라인을 통과 할 때, 느린 라인이 ?? 라인을 통과 할 때, 구매 신호; 반대로, 판매 신호. 이동 평균은 중·장기 추세를 효과적으로 판단한다.
Stochastic 지표. 이 지표는 다공이 교차하는 시간을 판단한다. %K 라인이 아래쪽에서 %D 라인을 뚫을 때, 구매 신호로; 위쪽에서 아래쪽에서 뚫을 때, 판매 신호로.
매칭 스코어 메커니즘. 위의 여러 요소의 매칭 상황에 따라 전략은 스코어 메커니즘을 채택한다. 매칭 인자가 많을수록 대응 신호의 강도도 높아진다.
여러 요소를 종합적으로 판단하여, 전략은 중·단기간에 더 많은 미세한 거래 기회를 잡을 수 있으며, 이로 인해 황소 시장에서 초과 수익을 얻을 수 있습니다.
다인자 조합 이동 평균 전략의 가장 큰 장점은 신호의 신뢰성을 높이는 데 있습니다. 단일 기술 지표는 잘못된 신호가 발생할 수 있습니다. 이 전략은 여러 지표가 결합되어 사용되며, 가짜 신호의 간섭을 효과적으로 줄일 수 있습니다.
또한, 단일 지표를 따르는 것보다 여러 요소의 조합이 거래의 승률을 높일 수 있습니다. 황소 시장에서 전략은 더 높은 누적 수익을 얻을 수 있습니다.
이 전략의 주요 위험은, 다중 요인 조합 자체가 전략의 복잡성을 증가시킬 수 있다는 것이다. 동시에 여러 지표의 파라미터 설정을 겸비해야 하는 것, 자주 조정하는 것 등이다.
또한, 곰 시장에서는 전략적 지분 기간이 너무 길어질 수 있다.
또한, 스토카스틱 지표와 HA 평균선과 같은 기술 지표는 갑작스러운 사건의 영향을 받기 쉽고, 잘못된 신호를 생성하여 불필요한 손실을 초래할 수 있다.
이 전략은 다음과 같은 부분에서 최적화될 수 있습니다.
각 지표 변수의 설정을 최적화하여 최적의 변수 조합을 찾습니다.
모델 트레이닝 및 파라미터 적응 모듈, 실시간 최적화 파라미터를 추가한다.
스톱로스 전략이 증가하고, 최대 철회 전략이 감소한다.
포지션 제어 모듈을 추가하여 시장 상황에 따라 포지션을 동적으로 조정합니다.
기계 학습 알고리즘과 결합하여 다중 인자 점수를 부여하는 신경망 모델을 구축합니다.
다인자 조합은 이동 평균 전략에 적응하여 여러 가지 기술 지표의 장점을 통합적으로 사용한다. 이 전략은 신호 품질을 효과적으로 증가시킬 수 있으며, 황소 시장에서 초과 수익을 얻을 수 있다. 그러나 동시에 전략의 복잡성이 증가하여 추가 테스트 및 최적화가 필요합니다.
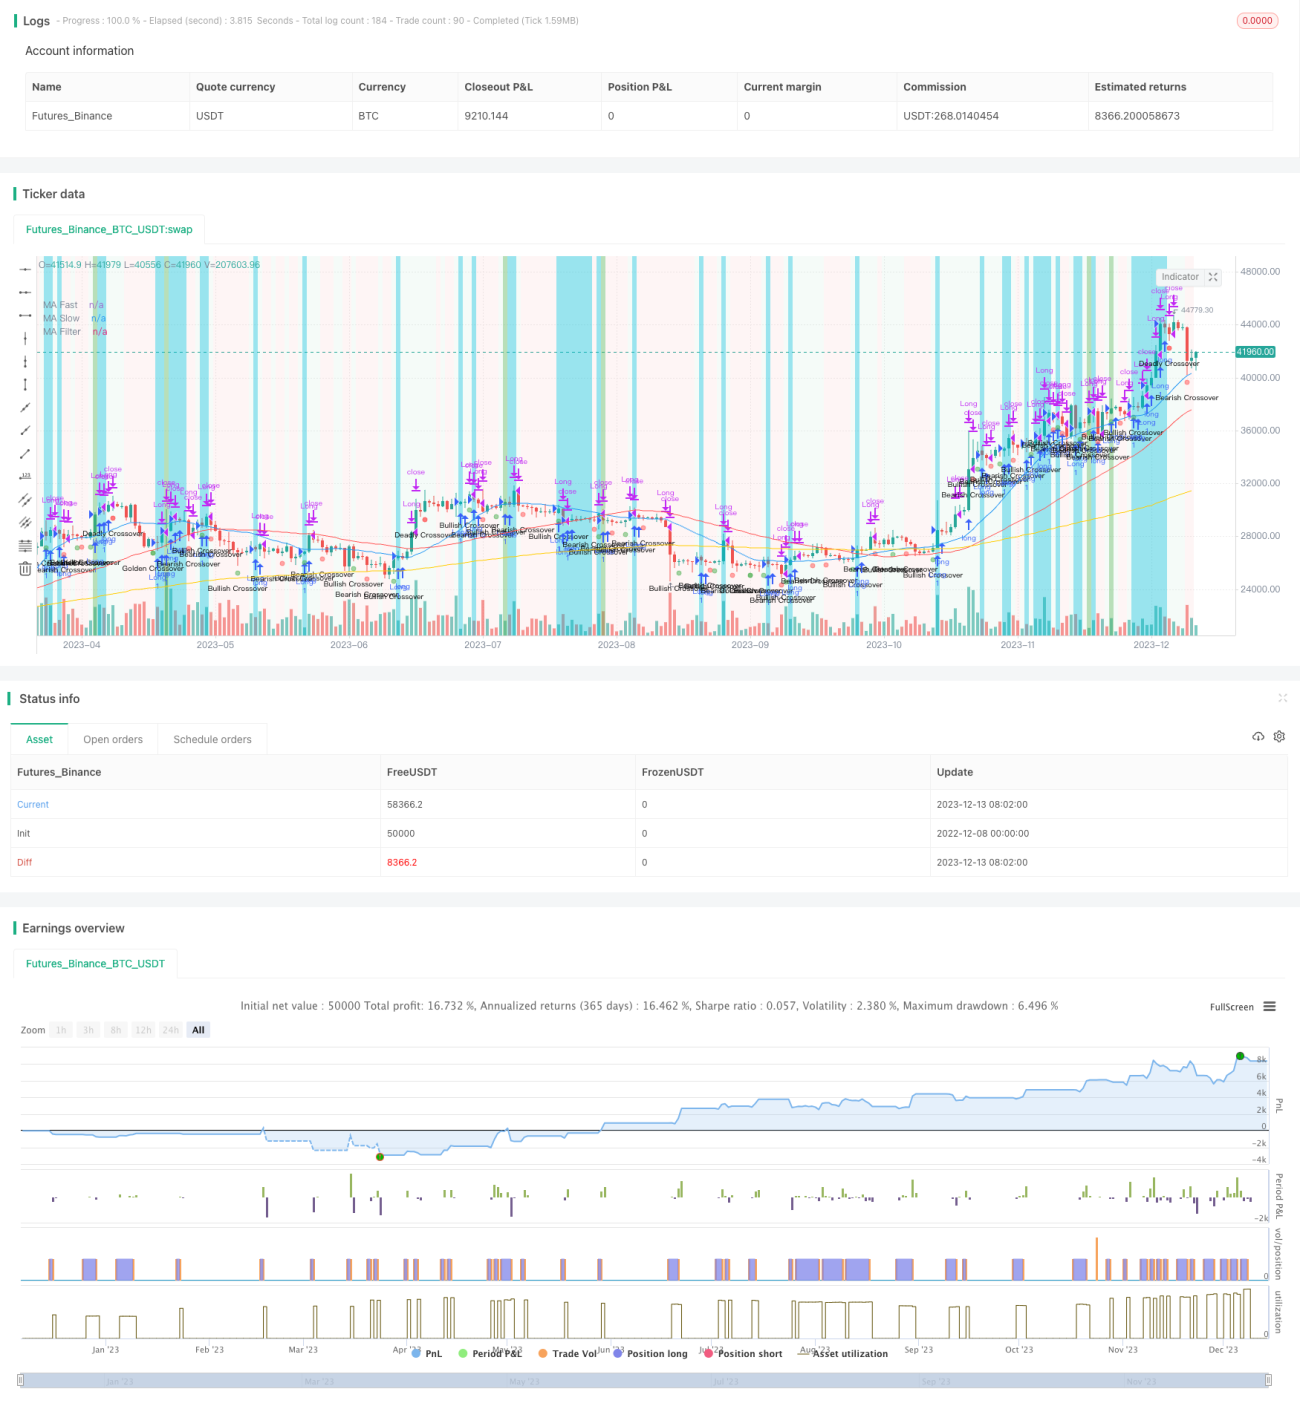
/*backtest
start: 2022-12-08 00:00:00
end: 2023-12-14 00:00:00
period: 1d
basePeriod: 1h
exchanges: [{"eid":"Futures_Binance","currency":"BTC_USDT"}]
*/
// This source code is subject to the terms of the Mozilla Public License 2.0 at https://mozilla.org/MPL/2.0/
// © cyrule
//@version=4
strategy("2nd Grade Strategy", overlay=true, shorttitle="2GTS", max_lines_count = 500, max_labels_count = 500, calc_on_every_tick = true, calc_on_order_fills = true, pyramiding = 1, default_qty_type = strategy.percent_of_equity, default_qty_value = 10)
source = input(close, title = "Source")
// **********************
// * Heikin-Ahshi *
// * kudos to garethyeo *
// **********************
showHA = input(true, title = "Show Heikin Ashi?", group = "Heikin Ashi")
ha_open = security(heikinashi(syminfo.tickerid), timeframe.period, open)
ha_high = security(heikinashi(syminfo.tickerid), timeframe.period, high)
ha_low = security(heikinashi(syminfo.tickerid), timeframe.period, low)
ha_close = security(heikinashi(syminfo.tickerid), timeframe.period, close)
bgcolor(iff(showHA and ha_open < ha_close , color.new(#53b987, transp = 92.5), na), title = 'Green HA')
bgcolor(iff(showHA and ha_open >= ha_close, color.new(#eb4d5c, transp = 92.5), na), title = 'Red HA' )
// ******************
// * Moving Average *
// ******************
// MA Settings
showMA = input(true, title = "Show Moving Averages?", group = "Moving Averages")
fastMALength = input(title = "Fast MA Length", minval = 1, step = 1, defval = 20, group = "Moving Averages")
slowMALength = input(title = "Slow MA Length", minval = 1, step = 1, defval = 50, group = "Moving Averages")
maType = input(title = "Moving Average Type", defval = "SMA", options = ["SMA", "EMA", "RMA", "WMA", "VWMA"], group = "Moving Averages")
filterMALength = input(title = "Filter MA Length", minval = 1, step = 1, defval = 200, group = "Moving Averages")
filterMAType = input(title = "Filter MA Type", defval = "EMA", options = ["SMA", "EMA", "RMA", "WMA", "VWMA"], group = "Moving Averages")
// Calculate MA
var float maFast = na
var float maSlow = na
var float maFilter = na
if (maType == "SMA")
maFast := sma(source, fastMALength)
maSlow := sma(source, slowMALength)
if (maType == "EMA")
maFast := ema(source, fastMALength)
maSlow := ema(source, slowMALength)
if (maType == "RMA")
maFast := rma(source, fastMALength)
maSlow := rma(source, slowMALength)
maFilter := rma(source, filterMALength)
if (maType == "WMA")
maFast := wma(source, fastMALength)
maSlow := wma(source, slowMALength)
if (maType == "VWMA")
maFast := vwma(source, fastMALength)
maSlow := vwma(source, slowMALength)
if (filterMAType == "SMA")
maFilter := sma(source, filterMALength)
if (filterMAType == "EMA")
maFilter := ema(source, filterMALength)
if (filterMAType == "RMA")
maFilter := rma(source, filterMALength)
if (filterMAType == "WMA")
maFilter := wma(source, filterMALength)
if (filterMAType == "VWMA")
maFilter := vwma(source, filterMALength)
BiruAtasMerah = (maFast >= maSlow) and (maSlow >= maFilter)
MerahAtasBiru = (maFast <= maSlow) and (maSlow <= maFilter)
// Lukis MA
plot(series = showMA ? maFast : na, color = color.blue, title = "MA Fast")
plot(series = showMA ? maSlow : na, color = color.red, title = "MA Slow")
plot(series = showMA ? maFilter : na, color = #FFCC00, title = "MA Filter")
// **************
// * Stochastic *
// **************
// Stochastic Settings
showSSC = input(true, title = "Show Stochastic Crossovers?", group = "Stochastic")
Length = input (10, minval = 1, title = "%K Length", group = "Stochastic")
SmoothK = input (3, minval = 1, title = "%K Smoothing", group = "Stochastic")
SmoothD = input (3, minval = 1, title = "%D Smoothing", group = "Stochastic")
// Calculate Stochastic
var float K = na
var float D = na
if (maType == "SMA")
K := sma(stoch(source, high, low, Length), SmoothK)
D := sma(K, SmoothD)
if (maType == "EMA")
K := ema(stoch(source, high, low, Length), SmoothK)
D := ema(K, SmoothD)
if (maType == "RMA")
K := rma(stoch(source, high, low, Length), SmoothK)
D := rma(K, SmoothD)
if (maType == "WMA")
K := wma(stoch(source, high, low, Length), SmoothK)
D := wma(K, SmoothD)
if (maType == "VWMA")
K := vwma(stoch(source, high, low, Length), SmoothK)
D := vwma(K, SmoothD)
StochasticCrossOver = crossover(K, D)
StochasticCrossUnder = crossunder(K, D)
// Lukis SS
plotshape(showSSC and StochasticCrossOver and K <= 20 ? K : na, text = "Golden\nCrossover", color = color.new(color.green, transp = 25), location = location.belowbar, size = size.tiny, title = "Golden Crossover" )
plotshape(showSSC and StochasticCrossUnder and K >= 80 ? D : na, text = "Deadly\nCrossover", color = color.new(color.red, transp = 25), location = location.belowbar, size = size.tiny, title = "Deadly Crossover" )
plotshape(showSSC and StochasticCrossOver and K <= 80 and K > 20 ? K : na, text = "Bullish\nCrossover", color = color.new(color.green, transp = 50), location = location.belowbar, size = size.tiny, title = "Bullish Crossover")
plotshape(showSSC and StochasticCrossUnder and K >= 20 and K < 80 ? D : na, text = "Bearish\nCrossover", color = color.new(color.red, transp = 50), location = location.belowbar, size = size.tiny, title = "Bearish Crossover")
showBull = input(true, title = "Show Bullish Signal?", group = "Signal")
showBear = input(false, title = "Show Bearish Signal?", group = "Signal")
bullishCriteria = 0
if (ha_open < ha_close) and (ha_open[1] < ha_close[1]) and (ha_open[2] >= ha_close[2])
bullishCriteria := bullishCriteria + 1
if (maFast > maSlow) and (maSlow > maFilter)
bullishCriteria := bullishCriteria + 1
if (K > D) and (K > K[1]) and (D > D[1])
bullishCriteria := bullishCriteria + 1
bearishCriteria = 0
if (ha_open >= ha_close) and (ha_open[1] >= ha_close[1]) and (ha_open[2] < ha_close[2])
bearishCriteria := bearishCriteria + 1
if (maFast < maSlow) and (maSlow < maFilter)
bearishCriteria := bearishCriteria + 1
if (K < D) and (K < K[1]) and (D < D[1])
bearishCriteria := bearishCriteria + 1
signal = color.new(color.white, transp = 0)
if bearishCriteria == 2
signal := color.new(color.orange, transp = 50)
if bearishCriteria == 3
signal := color.new(color.red, transp = 50)
if bullishCriteria == 2
signal := color.new(color.aqua, transp = 50)
if bullishCriteria == 3
signal := color.new(color.green, transp = 50)
bullishCriteria := showBull ? bullishCriteria : 0
bearishCriteria := showBear ? bearishCriteria : 0
bgcolor(iff(bullishCriteria > 1, signal, na), title = 'Bullish Signal')
bgcolor(iff(bearishCriteria > 1, signal, na), title = 'Bearish Signal')
longTPPerc = input(title = "Take Profit Threshold (%)" , minval = 0.0, step = 0.5, defval = 2.5, group = "Trading") / 100
profitRatio = input(title = "Profit-to-Loss ratio (risk tolerance)", minval = 1.0, step = 0.1, defval = 1.4, group = "Trading")
longSLPerc = longTPPerc / profitRatio
takeProfit = strategy.position_avg_price * (1 + longTPPerc)
stopLoss = strategy.position_avg_price * (1 - longSLPerc)
strategy.initial_capital = 50000
strategy.entry("Long" , strategy.long , floor(strategy.initial_capital*.1/close), stop = strategy.position_avg_price * 1.25, when = bullishCriteria > 1)
strategy.entry("Short", strategy.short, floor(strategy.initial_capital*.1/close), stop = strategy.position_avg_price * 1.25, when = bearishCriteria > 1)
strategy.close("Long" , when = (open >= takeProfit) or (open <= stopLoss) or (high >= takeProfit) or (low <= stopLoss))
strategy.close("Short", when = (open >= takeProfit) or (open <= stopLoss) or (high >= takeProfit) or (low <= stopLoss))
plotshape(bullishCriteria, location = location.belowbar, color = color.new(color.black, transp = 100))
plotshape(bearishCriteria, location = location.belowbar, color = color.new(color.black, transp = 100))