
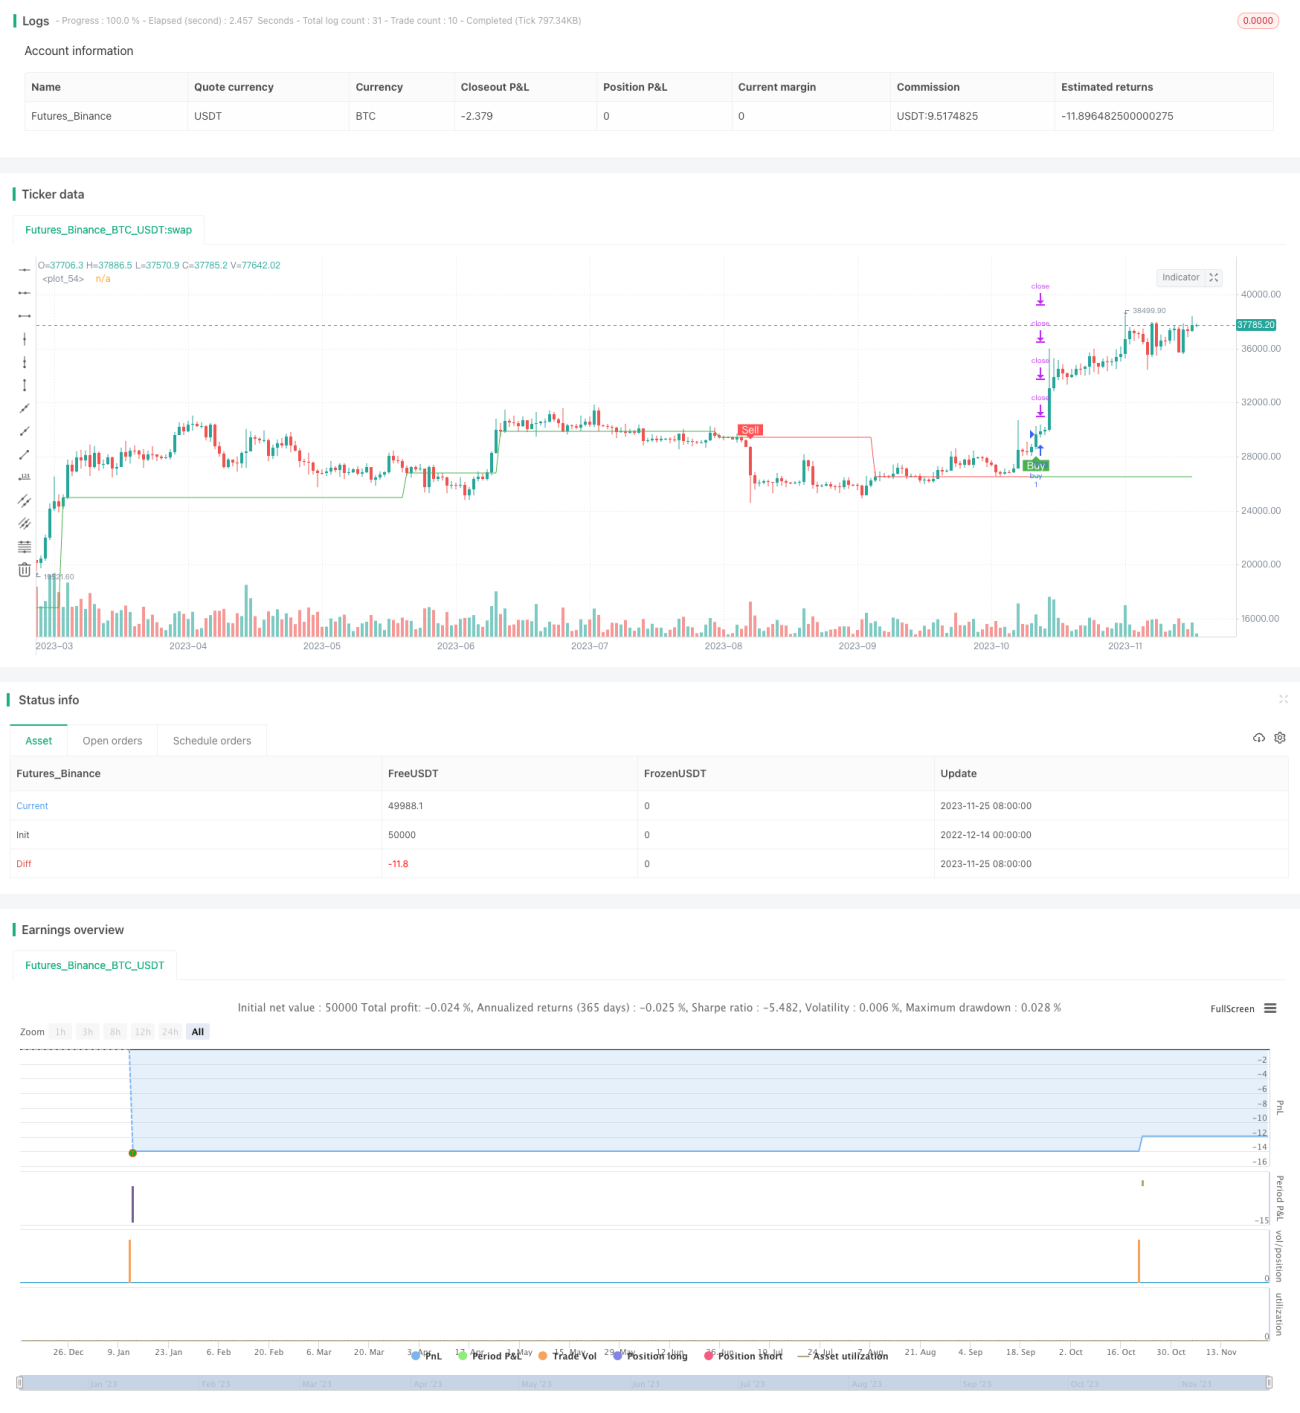
이 전략은 상대적으로 약한 지표 ((TRSI) 와 슈퍼 트렌드 지표 ((SUPER Trend) 를 결합하여 비교적 완전한 수량 거래 전략을 형성합니다. 이 전략은 주로 중·장기 트렌드를 포착하는 데 사용되며, 단기 지표가 노이즈 거래 신호를 필터링합니다.
구체적으로, 전략은 먼저 TRSI 지표를 계산하여 시장에서 과매매 지역이 있는지 판단하고, 다음에는 SUPER Trend 지표를 계산하여 큰 트렌드 방향을 판단한다. 둘을 결합하여 거래 신호를 낸다.
이 전략에는 다음과 같은 장점이 있습니다.
이 전략에는 몇 가지 위험도 있습니다.
이러한 위험들에 대해, 우리는 다음과 같은 몇 가지 측면에서 최적화할 수 있습니다:
이 전략은 TRSI와 SUPER Trend과 같은 여러 지표를 통합하여 보다 완전한 양적 거래 전략을 형성한다. 중장선 트렌드를 효과적으로 식별할 수 있으며, 동시에 스톱포드 제어 위험을 설정한다. 전략의 최적화 공간은 여전히 넓으며, 이후 신호 정확도를 높이고, 더 많은 거래 기회를 식별하는 등의 측면에서 개선할 수 있다. 전반적으로 이것은 양적 전략의 좋은 출발점이다.
/*backtest
start: 2022-12-14 00:00:00
end: 2023-11-26 05:20:00
period: 1d
basePeriod: 1h
exchanges: [{"eid":"Futures_Binance","currency":"BTC_USDT"}]
*/
//@version=4
strategy(title = "SuperTREX strategy", overlay = true)
strat_dir_input = input(title="Strategy Direction", defval="long", options=["long", "short", "all"])
strat_dir_value = strat_dir_input == "long" ? strategy.direction.long : strat_dir_input == "short" ? strategy.direction.short : strategy.direction.all
strategy.risk.allow_entry_in(strat_dir_value)
length = input( 14 )
overSold = input( 35 )
overBought = input( 70 )
HTF = input("W", type=input.resolution)
ti = change( time(HTF) ) != 0
p = fixnan( ti ? close : na )
vrsi = rsi(p, length)
price = close
var bool long = na
var bool short = na
long :=crossover(vrsi,overSold)
short := crossunder(vrsi,overBought)
var float last_open_long = na
var float last_open_short = na
last_open_long := long ? close : nz(last_open_long[1])
last_open_short := short ? close : nz(last_open_short[1])
entry_value =last_open_long
entry_value1=last_open_short
xy=(entry_value+entry_value)/2
// INPUTS //
st_mult = input(4, title = 'SuperTrend Multiplier', minval = 0, maxval = 100, step = 0.01)
st_period = input(10, title = 'SuperTrend Period', minval = 1)
// CALCULATIONS //
up_lev =xy - (st_mult * atr(st_period))
dn_lev =xy + (st_mult * atr(st_period))
up_trend = 0.0
up_trend := entry_value[1] > up_trend[1] ? max(up_lev, up_trend[1]) : up_lev
down_trend = 0.0
down_trend := entry_value1[1] < down_trend[1] ? min(dn_lev, down_trend[1]) : dn_lev
// Calculate trend var
trend = 0
trend := close > down_trend[1] ? 1: close < up_trend[1] ? -1 : nz(trend[1], 1)
// Calculate SuperTrend Line
st_line = trend ==1 ? up_trend : down_trend
plot(xy,color = trend == 1 ? color.green : color.red)
buy=crossover( close, st_line)
sell1=crossunder(close, st_line)
buy1=buy
//
sell=sell1
// STRATEGY
plotshape(buy , title="buy", text="Buy", color=color.green, style=shape.labelup, location=location.belowbar, size=size.small, textcolor=color.white, transp=0) //plot for buy icon
plotshape(sell, title="sell", text="Sell", color=color.red, style=shape.labeldown, location=location.abovebar, size=size.small, textcolor=color.white, transp=0) //plot for sell icon
// Take profit
//
l = buy
s1=sell
if l
strategy.entry("buy", strategy.long)
if s1
strategy.entry("sell", strategy.short)
per(pcnt) => strategy.position_size != 0 ? round(pcnt / 100 * strategy.position_avg_price / syminfo.mintick) : float(na)
stoploss=input(title=" stop loss", defval=25, minval=0.01)
los = per(stoploss)
q1=input(title=" qty_percent1", defval=25, minval=1)
q2=input(title=" qty_percent2", defval=25, minval=1)
q3=input(title=" qty_percent3", defval=25, minval=1)
tp1=input(title=" Take profit1", defval=2, minval=0.01)
tp2=input(title=" Take profit2", defval=4, minval=0.01)
tp3=input(title=" Take profit3", defval=6, minval=0.01)
tp4=input(title=" Take profit4", defval=8, minval=0.01)
strategy.exit("x1", qty_percent = q1, profit = per(tp1), loss = los)
strategy.exit("x2", qty_percent = q2, profit = per(tp2), loss = los)
strategy.exit("x3", qty_percent = q3, profit = per(tp3), loss = los)
strategy.exit("x4", profit = per(tp4), loss = los)