
概述
布林带和RSI短线策略是一个以布林带和相对强弱指数(RSI)为基础的短线交易策略。它结合了布林带判断市场是否过热和RSI判断市场动能的方法,寻找做空机会。当股价突破布林带上轨,且RSI大于70时,认为行情过热,此时做空;当布林带下轨突破股价时,认为行情转冷,平仓止损。
策略原理
该策略主要基于两个指标:
-
布林带。布林带由中轨、上轨和下轨组成。中轨是n天的移动平均线,上下轨分别是中轨上下n*标准差所构成。当价格从下轨反弹到上轨时,认为行情过热;当价格从上轨回落到下轨时,认为行情冷却。
-
RSI。RSI通过比较一段时间内的平均涨幅和跌幅,来判断涨势和跌势的强弱。RSI大于70时表示股价行情过热,小于30时表示股价行情超卖。
具体交易逻辑为:
-
当股价上穿布林带上轨,且RSI大于70时,符合布林带过热信号和RSI超买信号,因此做空;
-
当股价下破布林带下轨时,行情转冷,因此平仓止损;
该策略同时设置了止损和止盈:
-
止损设置为入场价*(1+1%),即承受1%的亏损;
-
止盈设置为入场价*(1-7%),即获得7%的盈利后平仓。
策略优势
该策略具有以下优势:
-
结合布林带和RSI两个指标,避免单一技术指标判断失误的概率;
-
利用布林带上下轨和RSI过买过卖区域判断入场和出场时机,精准定位短线交易机会;
-
在入场前设置止损和止盈点位,可控制风险;
-
简单明确的交易逻辑,容易理解实施;
-
可灵活设置布林带和RSI参数,适应不同周期和市场环境。
策略风险
尽管该策略具有以上优势,也存在一定风险需要规避:
-
布林带和RSI皆为追随趋势的指标,不适合震荡或无明确方向的行情;
-
无法保证止损和止盈总是会被完美触发;
-
极端行情可能会突破止损位,带来超出预期的亏损;
-
需要不断优化布林带和RSI参数以适应市场变化。
对应风险规避方法:
-
结合志愿者锚定移动平均等基础指标判断局部趋势方向,避免无谓反转;
-
适当缩小持仓规模,多组合多策略,分散风险;
-
提高止损幅度或设置超级止损来应对极端行情;
-
根据实盘测试结果持续调整布林带和RSI参数设置。
策略优化方向
该策略可考虑以下几个方向进一步优化:
-
结合其它指标避免无谓反转。例如EMA,MACD等。
-
根据不同品种和周期测试最优参数。周期可以考虑15分钟,30分钟和1小时线等。主流数字货币和股票可作为测试品种。
-
设置动态止损,根据市场波动程度实时调整止损点。这可以缓解止损被突破的风险。
-
考虑结合算法交易的方法进行优化。利用机器学习和遗传算法自动寻找最优参数或捕捉更复杂的交易模式。
总结
该短线交易策略首先通过布林带和RSI判断市场热度和动能,找到最佳做空时机,然后利用止损止盈来控制风险。策略优势在于简单直接,易于实施。主要风险在于指标局限性和止损被套。应对方法是结合更多指标判断,动态调整参考数以及适当放宽止损。该策略有很大优化空间,未来可考虑引入更多指标判断和算力优化。
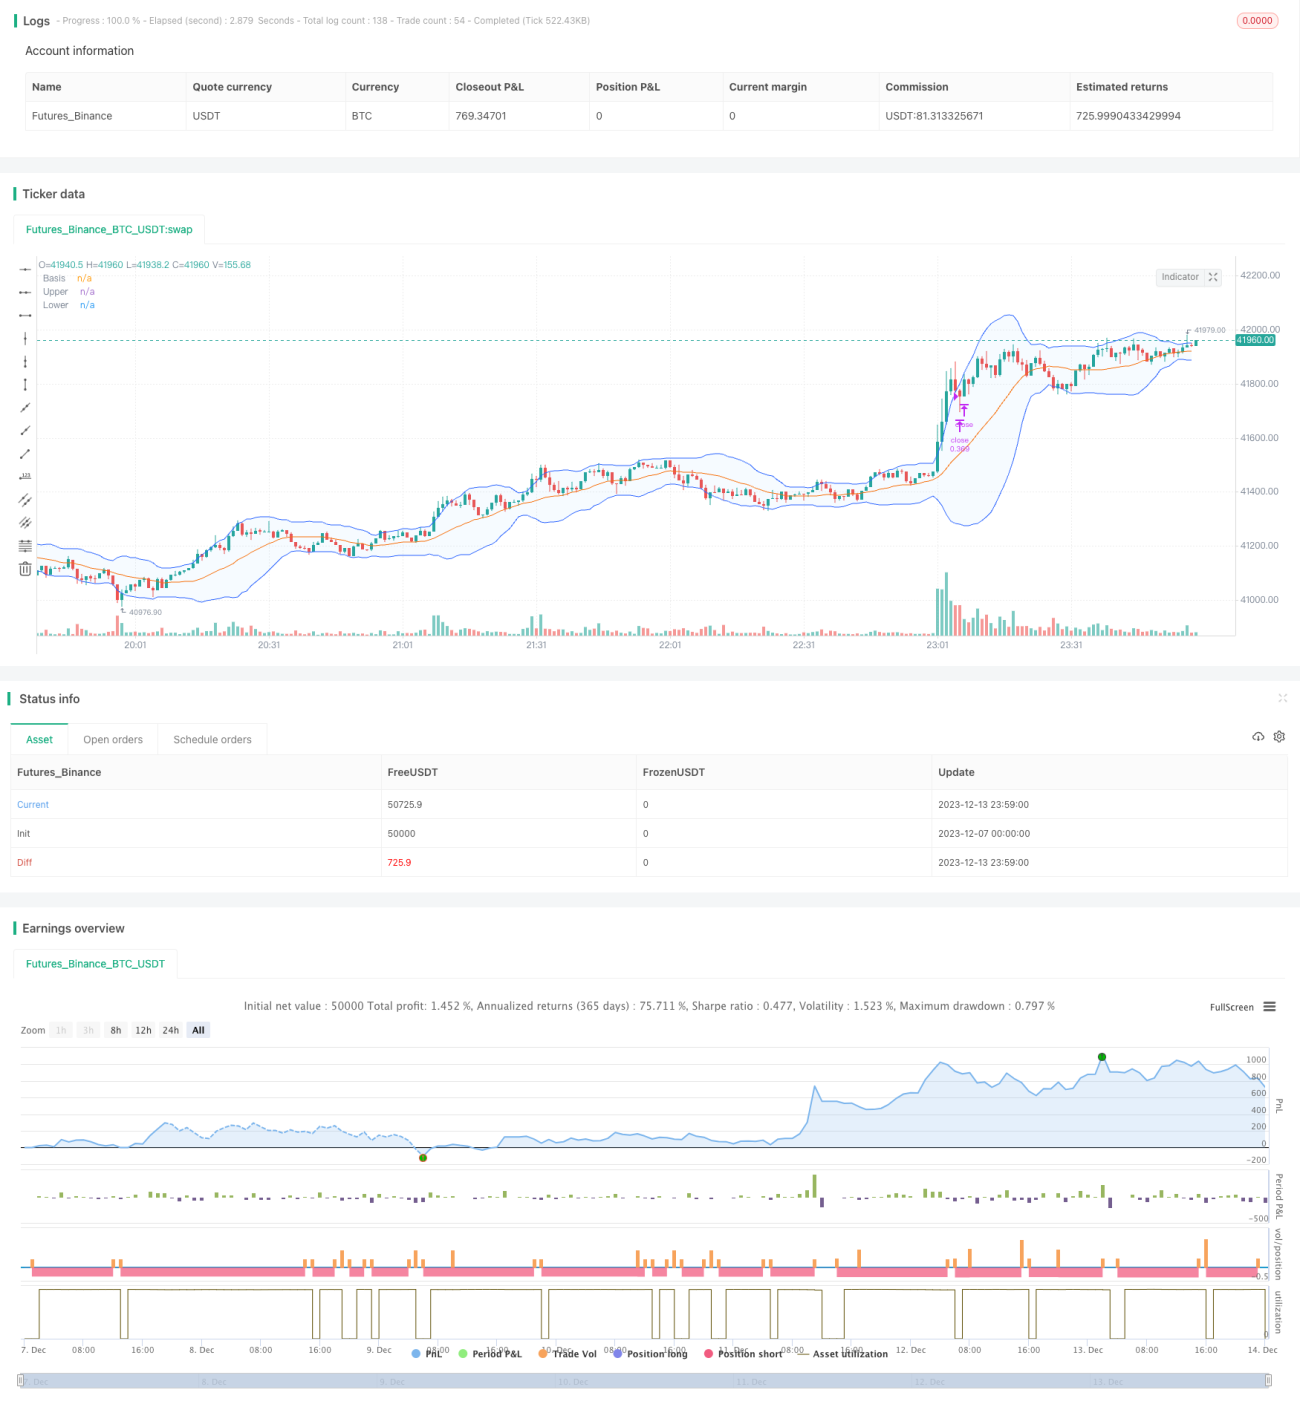
/*backtest
start: 2023-12-07 00:00:00
end: 2023-12-14 00:00:00
period: 1m
basePeriod: 1m
exchanges: [{"eid":"Futures_Binance","currency":"BTC_USDT"}]
*/

// This source code is subject to the terms of the Mozilla Public License 2.0 at https://mozilla.org/MPL/2.0/
// © Coinrule
// Works best on 30m, 45m timeframe
- 1