Reverse Trading Strategy Based on Overlapping Price Differentials

Overview
The main idea of this strategy is to use the overlapping price differentials to judge market trends. It goes long when the differential reverses from negative to positive, and goes short when the differential reverses from positive to negative. It belongs to reverse trading strategies.
Principle
The strategy first calculates the overlapping price differential (Close-Close[1]), which is today's close price minus yesterday's close price, and then calculates the sum of the differentials over the past 30 days. It generates a long signal when the sum reverses from negative to positive, and generates a short signal when the sum reverses from positive to negative. It is a typical reverse trading strategy.
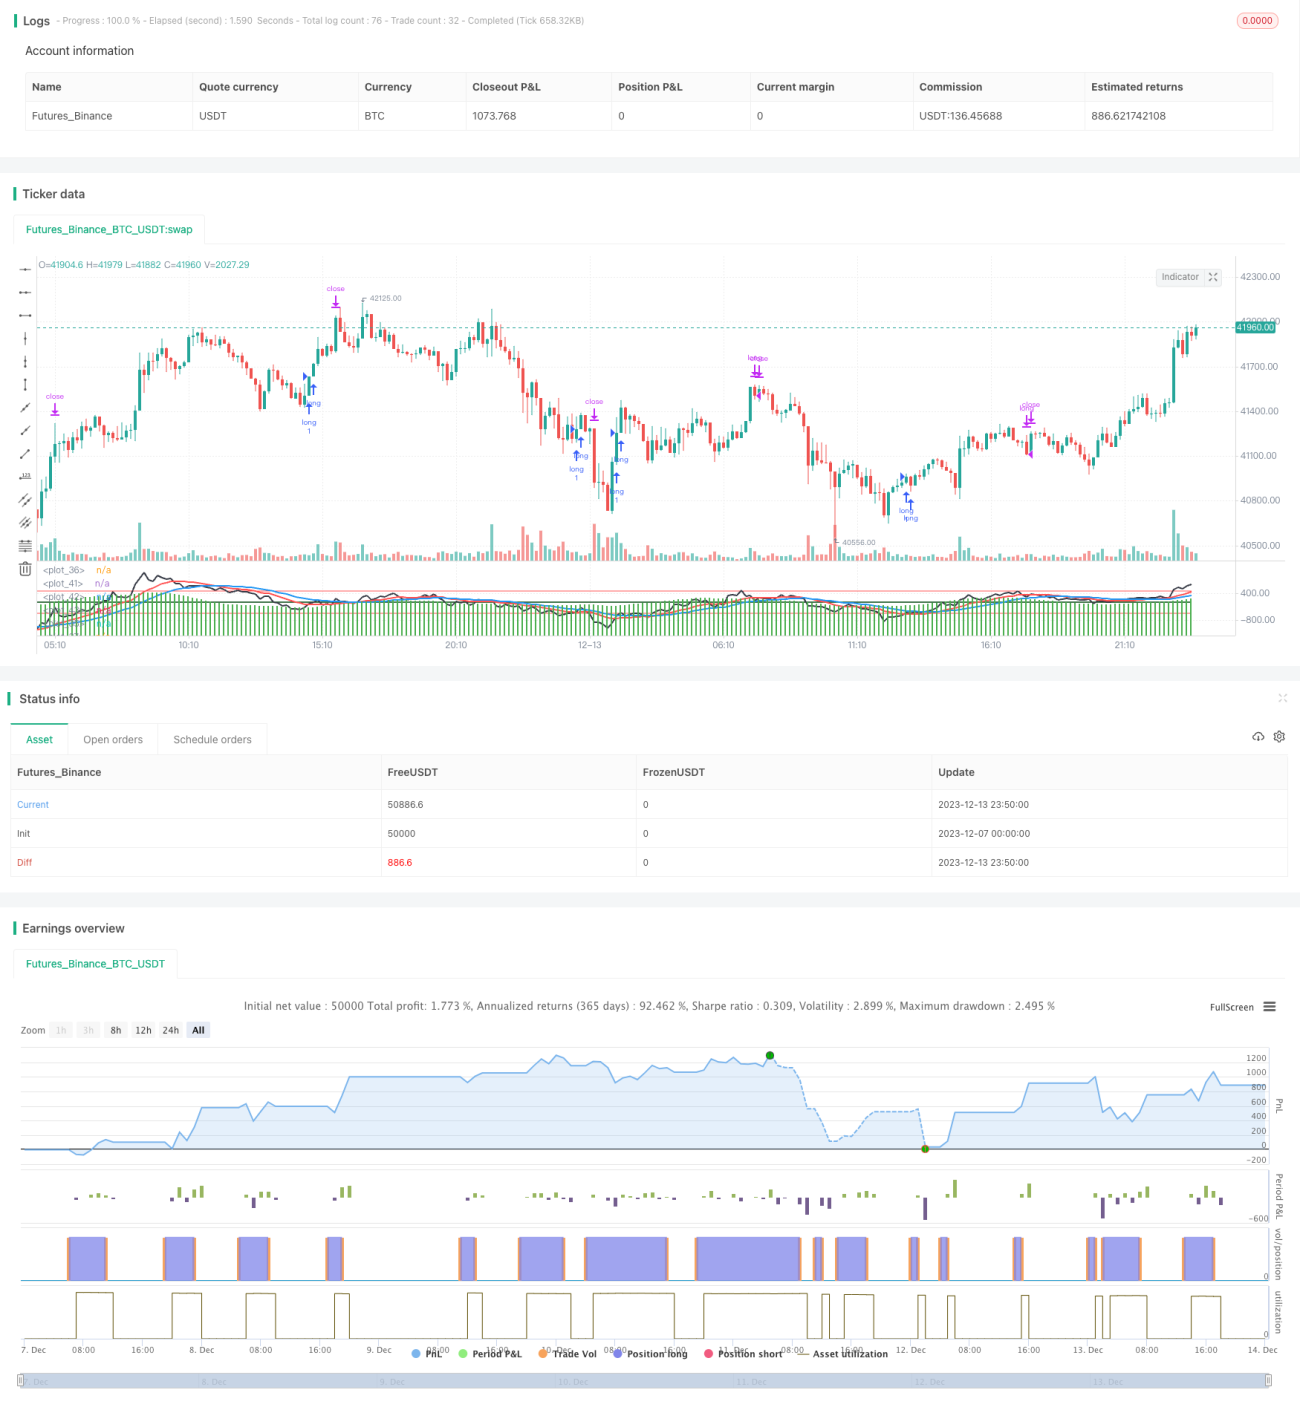
Specifically, the strategy maintains three indicators:
- ff: Sum of price differentials over the past 30 days
- dd1: 15-day weighted moving average of ff
- dd2: 30-day weighted moving average of ff
It generates a long signal when ff changes from negative to positive, i.e. from less than 0 to greater than 0, and dd1 also changes from negative to positive.
It generates a short signal when ff changes from positive to negative, i.e. from greater than 0 to less than 0, and dd1 also changes from positive to negative.
After going long or short, take profit and stop loss lines will be set.
Advantages
The strategy has the following advantages:
- The logic is clear and easy to understand and implement.
- It captures good entry timing at market turning points by utilizing price reversal features.
- False breakouts can be filtered out with the dual confirmation mechanism.
- Customizable parameters adapt to different market environments.
Risks
There are also some risks for the strategy:
- High probability of reversal failure, likely to be stopped out in range-bound markets.
- Improper parameter settings may lead to frequent trading and increased transaction costs.
- Other indicators should be incorporated to filter entries, avoiding chasing tops and bottoms.
The corresponding solutions are:
- Set proper stop loss percentage to control single loss.
- Optimize parameters to find the best combination.
- Add filtering conditions to avoid unnecessary entries.
Optimization Directions
The strategy can be optimized in the following aspects:
- Add volume filter, requiring enlarged volume on breakouts.
- Incorporate trend indicators to avoid countertrend operations.
- Dynamically adjust parameters to adapt to changing market conditions.
- Optimize stop loss mechanism, such as trailing stop loss.
Summary
The strategy judges market turning points by calculating price differential reversals. It is a typical reverse trading strategy. The logic is clear and easy to implement with some practical value. But there are also risks that need to be further optimized to adapt to market changes. Overall, the strategy provides a basic framework for quantitative trading, which can be built upon and extended.
- 1