다중 요인 모델을 기반으로 한 적응형 추세 추종 전략

개요
이 전략은 다중 인자 모델에 의해 주도하는 적응 트렌드 추적 전략이다. 그것은 RSI, MACD, Stochastics와 같은 여러 지표를 통합, 다중 인자 모델 판단 트렌드 방향을 구축한다. 동시에, 그것은 ATR의 동력에 따라 중지 가격을 조정할 수 있는 적응 스로프 메커니즘을 가지고 있으며, 위험을 제어한다.
원칙
이 전략은 여러 지표들을 사용하여 트렌드를 판단하는 모델을 구축한다. 첫째, RSI, MACD와 함께 트렌드 방향을 판단한다. 다음, 스토카스틱스와 함께 과매매를 판단하고, 일부 신호를 필터링한다. 주문이 들어간 후, ATR을 사용하여 위험 파라미터를 계산하여 자율적 인 손실을 달성한다.
구체적으로, RSI가 52보다 높고 MACD 골드 포크가 있을 때 구매 신호를 생성하고; RSI가 48보다 낮고 MACD 디드 포크가 있을 때 판매 신호를 생성한다. 가짜 신호를 필터링하기 위해, Stochastics가 과매매를 초과하는지 여부를 검출한다.
장점
이 전략의 가장 큰 장점은 위험 제어 능력이 강하다는 것입니다. 다중 요소 모델을 통해 트렌드 방향을 판단하여 일부 잡음을 필터링하여 신호 품질을 향상시킬 수 있습니다. 동시에, 적응형 손해 중지 메커니즘은 시장의 변동 정도에 따라 손해 중지 폭을 조정하여 단독 손실을 효과적으로 제어 할 수 있습니다.
또한, 이 전략의 매개 변수 설정은 합리적이고, 재측량 효과는 더 좋다. 다른 주기 자산은 매개 변수를 조정하여 최적화 할 수 있다. 매개 변수를 최적화하여 더 많은 시장 환경에 적응할 수 있다.
위험
이 전략의 주요 위험은 다인자 모델 구축의 품질에 있다. 모델 구축이 적절하지 않으면, 트렌드를 효과적으로 판단할 수 없게 되면, 많은 잘못된 신호를 생성할 수 있다. 또한, 상쇄 전략 자체에는 중매가 될 위험이 있다.
이러한 위험을 줄이기 위해, 모델 무게를 조정하고, 매개 변수 설정을 최적화하고, 다른 손해 방지 전략을 조합하는 등의 측면에서 개선할 수 있다. 비정상적인 시장이 발생했을 때, 수동 개입도 필요하다.
최적화 방향
이 전략은 다음과 같은 부분에서 최적화될 수 있습니다.
-
다중 인자 모델에서 지표 무게를 조정하여 최적의 무게 조합을 찾습니다.
-
CCI, 변동률 등과 같은 더 많은 지표를 테스트하고, 다중 요소 모델을 풍부하게 만듭니다.
-
더 많은 품종과 주기를 위한 최적화된 파라미터 설정
-
다른 전략들을 시도해서 최적의 조합을 찾아보세요.
-
모델 훈련 및 전략 평가 모듈을 추가하여 기계 학습을 실행합니다.
요약하다
이 전략은 다인자 모형과 적응형 손해 중지 메커니즘을 통합하여 트렌드 판단과 위험 제어의 유기적인 결합을 구현한다. 그것은 재측량 효과가 좋으며 확장성이 있다. 지속적인 최적화를 통해 장기적으로 보유할 가치가 있는 정량 전략이 될 수 있다.
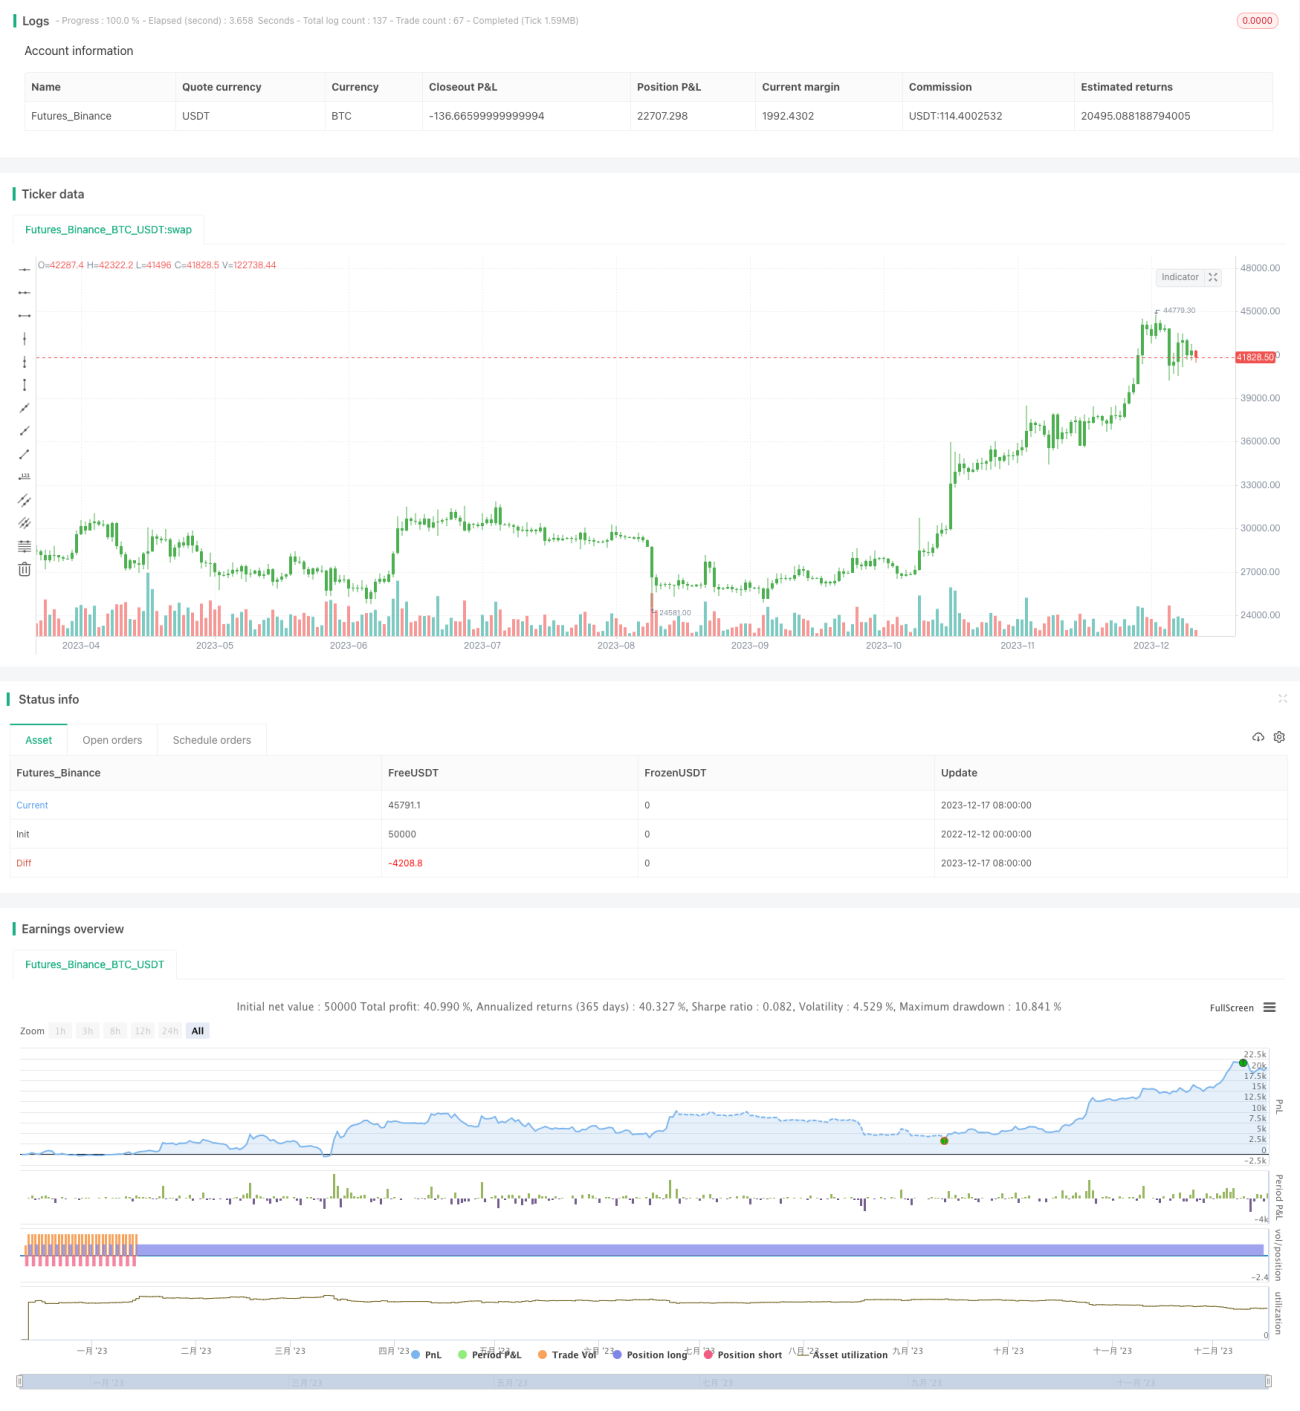
/*backtest
start: 2022-12-12 00:00:00
end: 2023-12-18 00:00:00
period: 1d
basePeriod: 1h
exchanges: [{"eid":"Futures_Binance","currency":"BTC_USDT"}]
*/

//@version=2
strategy(title="TradersAI_UTBot", overlay = true)
// CREDITS to @HPotter for the orginal code.
// CREDITS to @Yo_adriiiiaan for recently publishing the UT Bot study based on the original code - - 1