개요
이 전략은 빠른 EMA 주기 및 느린 EMA 주기의 지수 이동 평균을 계산하여 차트에 그리며, 실시간으로 그 교차 상황을 모니터링하여 가격 경향의 전환을 판단합니다. RSI 과잉 매매 지표와 결합하여 가짜 신호를 피하여 거래 신호를 형성합니다. 빠른 EMA가 느린 EMA를 상향으로 돌파 할 때 구매 신호를 생성합니다. 빠른 EMA가 느린 EMA를 상향으로 돌파 할 때 판매 신호를 생성합니다.
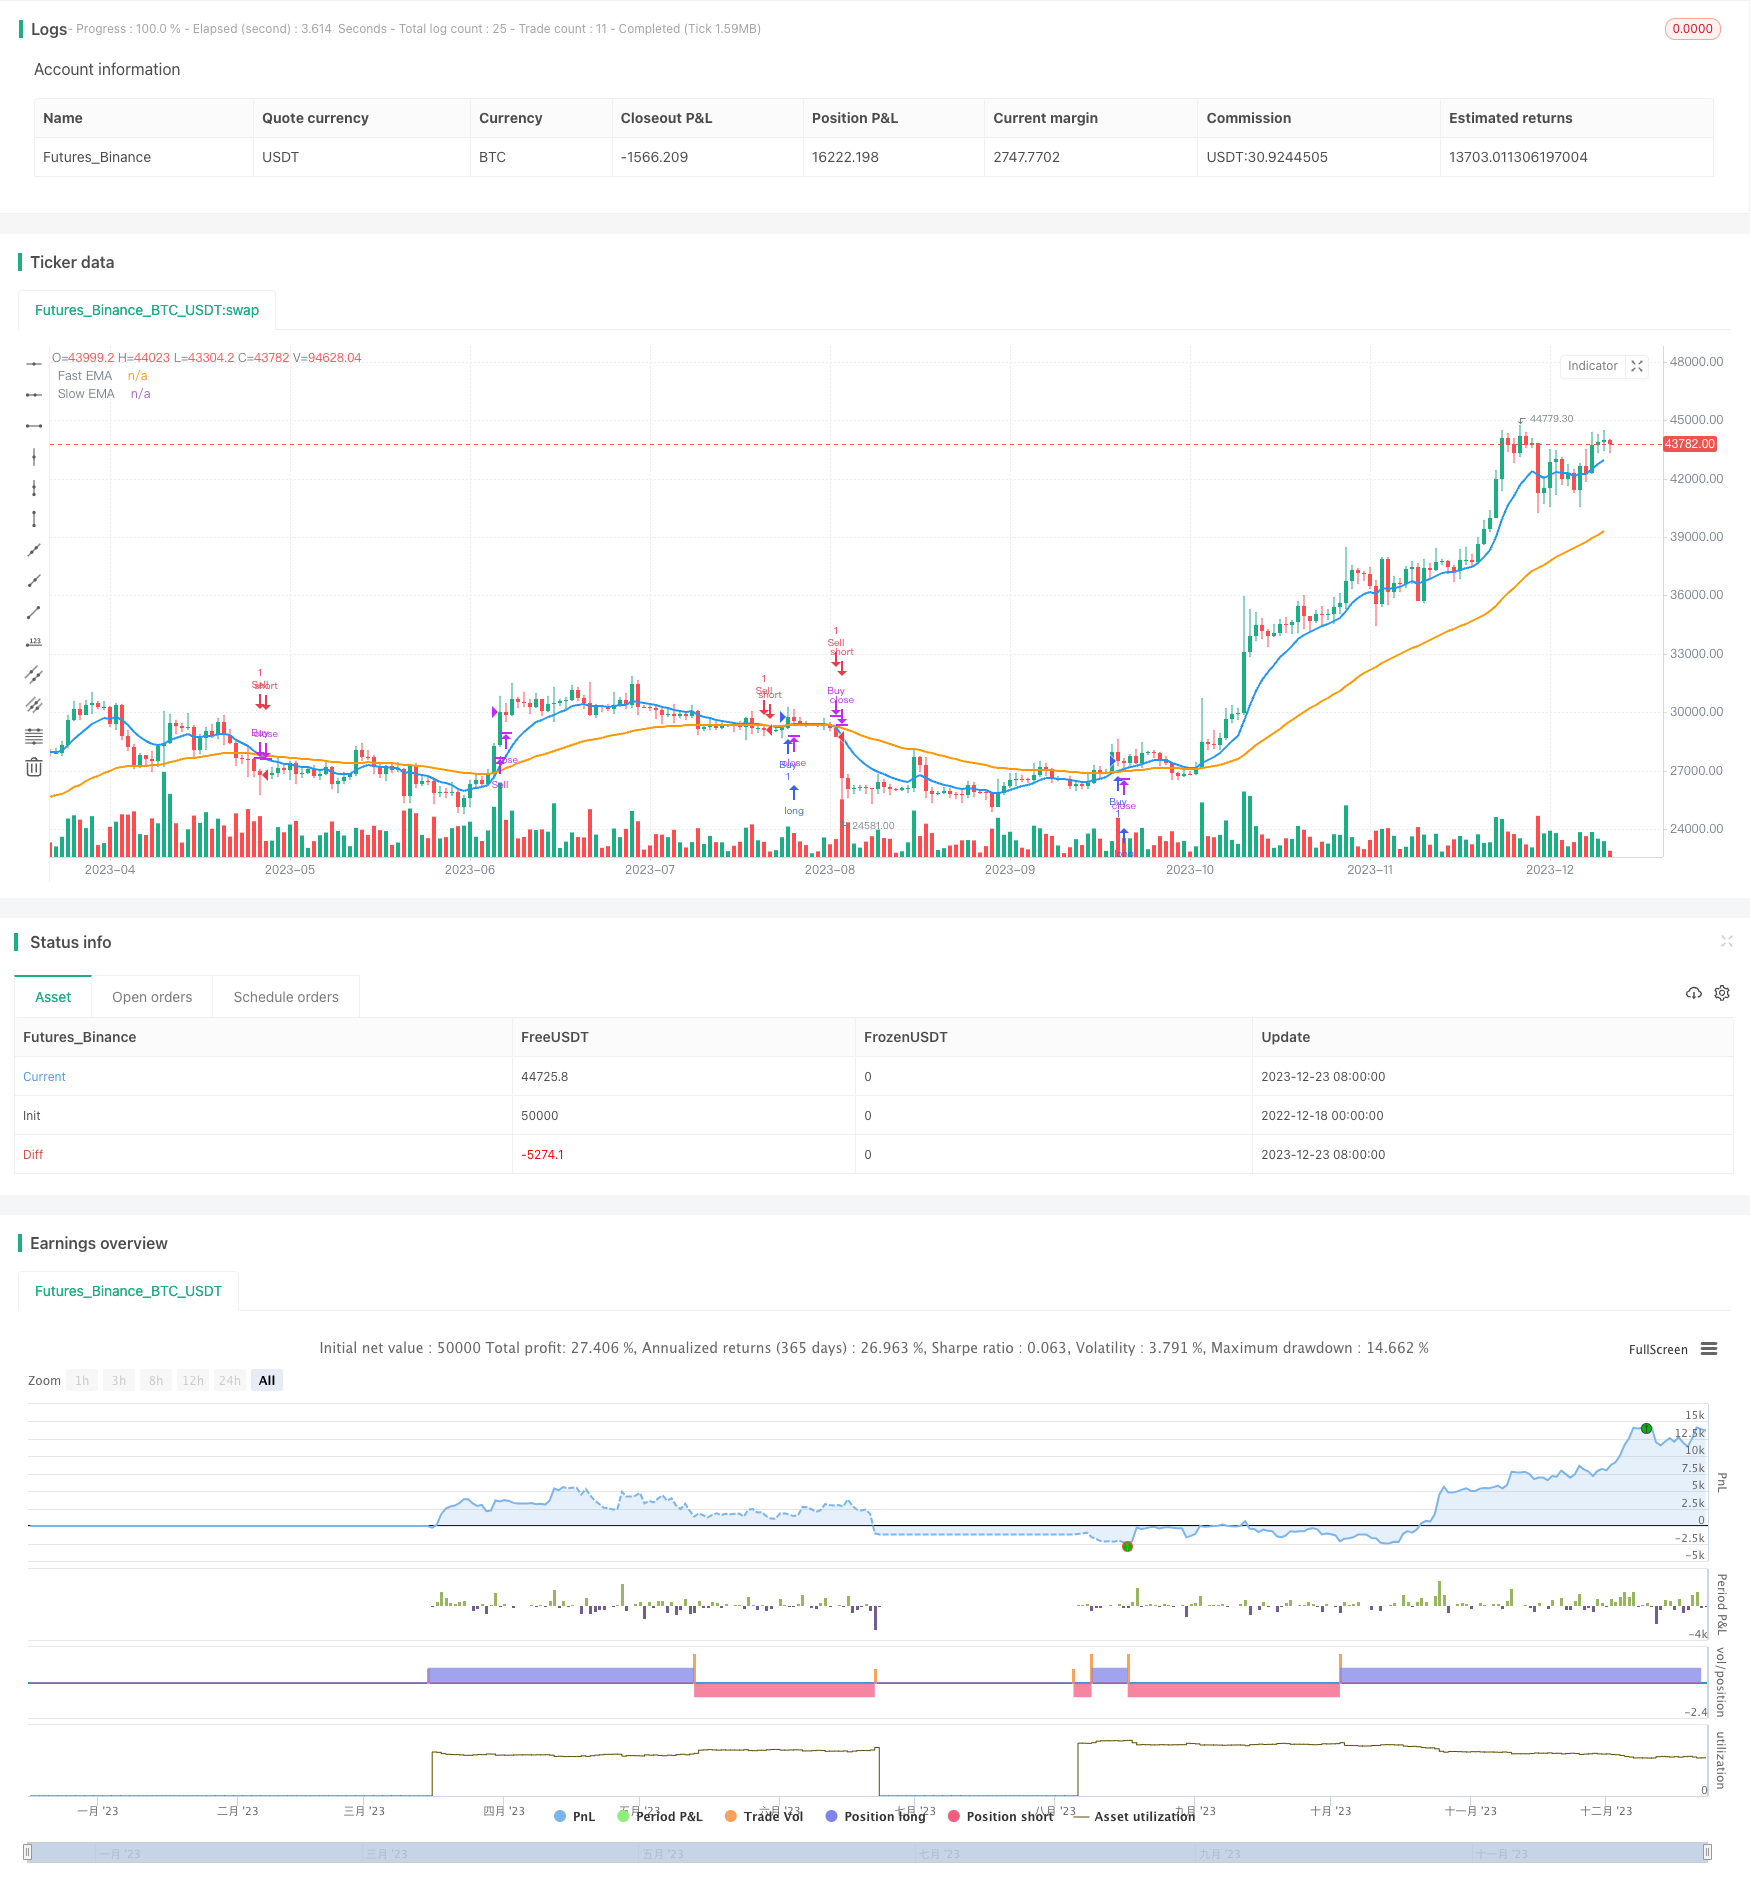
전략 원칙
- 빠른 EMA 주기 및 느린 EMA 주기 지수 이동 평균을 계산
- 그래프에 그려서 실시간으로 교차로를 감시합니다.
- 빠른 EMA가 느린 EMA를 상향으로 돌파하면 상승 추세로 판단하여 구매 신호를 형성합니다.
- 빠른 EMA가 느린 EMA를 넘어 내려가면 하향 추세로 판단하여 판매 신호를 형성합니다.
- RSI와 결합하여 가짜 신호를 피하십시오.
- 트렌드 필터 조건을 설정하여 트렌드가 변할 때만 거래합니다.
우위 분석
- EMA를 사용하여 트렌드 전환을 판단하고 작은 범위의 변동에 민감하지 않습니다.
- RSI 지표 필터링은 반전 가짜 신호를 방지합니다.
- 사용자 정의 EMA 주기와 RSI 매개 변수, 다른 시장에 적응
- 코드는 직관적이고 간결하며 이해하기 쉬운 구현입니다.
위험 분석
- EMA는 지연되고 전환점을 놓칠 수 있습니다.
- 시장의 큰 흔들림 속에서 EMA의 판단이 무효
- EMA 및 RSI 변수를 적절하게 조정해야 합니다.
- 다른 지표와 결합 가능한 검증 신호
최적화 방향
- 다른 지표와 결합하여 검증 신호 확실성
- 손실을 막는 전략에 대한 위험을 증가시키는 것
- 다른 주기 변수의 안정성을 테스트하는 방법
- 통화 강도 지표를 늘리고 통화 위험을 피하는 것
- 거래 비용 최적화 수익률을 고려
요약하다
이 전략은 전체적인 아이디어가 명확하며, EMA를 사용하여 트렌드 전환을 판단하고, RSI 지표 필터 신호와 결합하여 중장선 트렌드를 효과적으로 캡처 할 수 있습니다. 그러나 EMA와 RSI의 매개 변수 조정 및 손실 전략은 여전히 최적화가 필요하며, 역전점과 흔들리는 시장을 놓칠 위험이 있습니다. 매개 변수 최적화 및 위험이 통제되면 이 전략은 중장선 트렌드 전환점을 발견하고 투자 결정을 내릴 수 있습니다.
전략 소스 코드
/*backtest
start: 2022-12-18 00:00:00
end: 2023-12-24 00:00:00
period: 1d
basePeriod: 1h
exchanges: [{"eid":"Futures_Binance","currency":"BTC_USDT"}]
*/

//@version=5
strategy("Trend Change with EMA Entry/Exit - Intraday", overlay=true)

// Define the fast and slow EMA periods
fast_ema_period = input(10, title="Fast EMA Period")
slow_ema_period = input(50, title="Slow EMA Period")

// Calculate the EMAs
ema_fast = ta.ema(close, fast_ema_period)
ema_slow = ta.ema(close, slow_ema_period)

// Plot the EMAs on the chart
plot(ema_fast, title="Fast EMA", color=color.blue, linewidth=2)
plot(ema_slow, title="Slow EMA", color=color.orange, linewidth=2)

// Detect trend changes (crossovers and crossunders)
is_uptrend = ta.crossover(ema_fast, ema_slow)
is_downtrend = ta.crossunder(ema_fast, ema_slow)

// Relative Strength Index (RSI)
rsi_length = input(14, title="RSI Length")
overbought_level = input(70, title="Overbought Level")
oversold_level = input(30, title="Oversold Level")
rsi_value = ta.rsi(close, rsi_length)

// Trend Filter
is_trending = ta.change(is_uptrend) != 0 or ta.change(is_downtrend) != 0

// Entry and Exit signals
enter_long = is_uptrend and rsi_value < overbought_level and is_trending
exit_long = is_downtrend and is_trending
enter_short = is_downtrend and rsi_value > oversold_level and is_trending
exit_short = is_uptrend and is_trending

strategy.entry("Buy", strategy.long, when=enter_long)
strategy.close("Buy", when=exit_long)
strategy.entry("Sell", strategy.short, when=enter_short)
strategy.close("Sell", when=exit_short)