개요
이 전략은 부린 띠 지표를 사용하여 가격이 오버 바이 오버 셀 영역에 진입했는지 여부를 판단하고, RSI 지표와 결합하여 오버 바이 영역이 죽은 포크를 형성할 때 공백을 만들고, 부린 띠를 넘어가는 가격 상승이 경로를 통과 할 때 중단됩니다.
전략 원칙
이 전략은 다음과 같은 원칙에 기초하고 있습니다.
- 종결 가격에서 부린 띠를 뚫고 궤도에 오르면, 자산이 과매도 영역에 들어갔을 때, 회수 기회가 있음을 나타냅니다.
- RSI 지표는 오버 바이 지역과 오버 세 지역을 효과적으로 판단합니다. RSI>70은 오버 바이 지역입니다.
- 마감 가격에서 상하로 이동할 때 상장 포지션을 해제합니다.
- RSI가 오버 바이 영역에서 다시 떨어지거나 스톱포인트에서 트리거되면 평점 스톱포인트
우위 분석
이 전략은 다음과 같은 장점을 가지고 있습니다.
- 브린을 사용하여 거래의 성공률을 높이기 위해 과매매 영역을 판단하십시오.
- RSI가 가짜 브레이크를 필터링하여 불필요한 손실을 방지합니다.
- 수익률이 높고 위험을 최대한 통제하는 방법
위험 분석
이 전략에는 다음과 같은 위험들이 있습니다.
- 파격 이후 계속 상승하여 손실이 더욱 확대되었습니다.
- RSI가 시간 내에 하락하지 않아 손실이 더 커졌습니다.
- 단독으로 포지션을 보유하여 시장을 정리할 수 없다
위험은 다음과 같은 방법으로 줄일 수 있습니다.
- 정지점을 적절하게 조정하고, 정지점을 적절하게 조정합니다.
- 다른 지표와 결합하여 RSI 회귀 신호를 판단합니다.
- 평평선 지표와 결합하여 상정 진입 여부를 판단하는 방법
최적화 방향
이 전략은 다음과 같은 측면에서 최적화될 수 있습니다.
- 더 많은 거래 품종을 위해 브린 벨트 매개 변수를 최적화
- RSI 파라미터를 최적화하여 지표의 효과를 향상시킵니다.
- 다른 지표의 조합을 추가하여 트렌드 전환점을 판단합니다.
- 다중 거래 논리 추가
- 스톱포인트를 동적으로 조정하는 스톱포인트 전략과 결합
요약하다
이 전략은 전체적으로 전형적인 초매 지역 빠른 단선 거래 전략이다. 부린 띠를 사용하여 매매점을 판단하고, RSI 필터 신호를 사용한다. 합리적인 손실을 통해 위험 수준을 제어한다. 변수 최적화, 포지션 지표, 포지션 개시 논리 등을 통해 효과를 향상시킬 수 있다.
전략 소스 코드
/*backtest
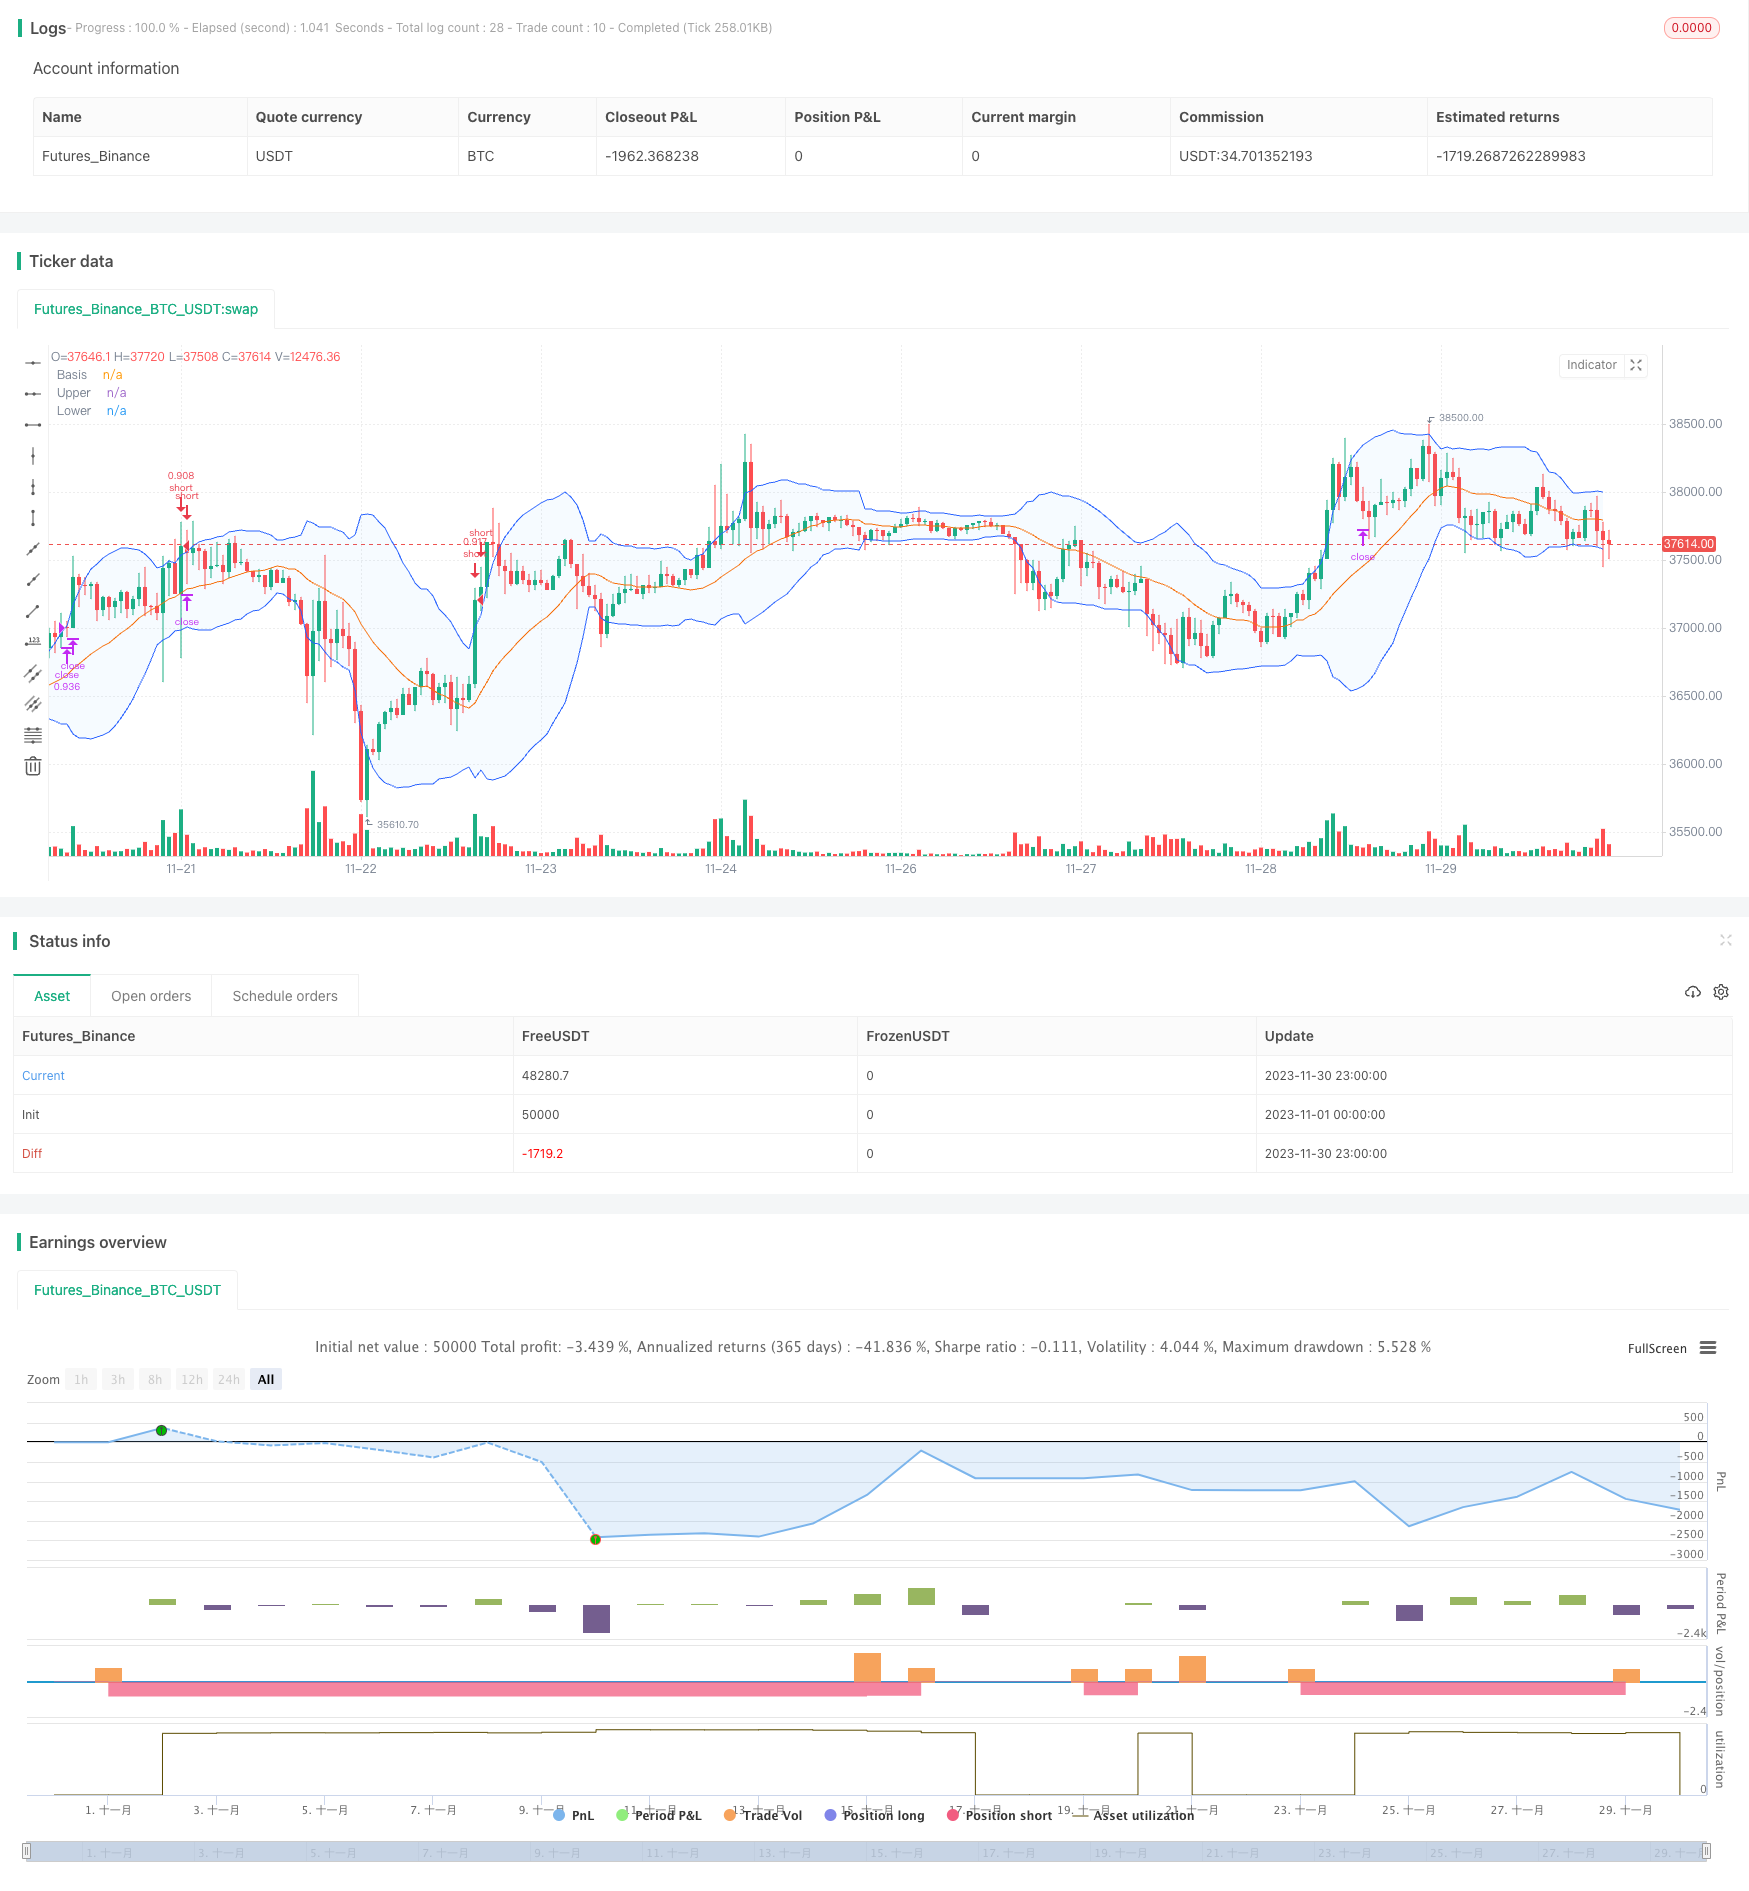
start: 2023-11-01 00:00:00
end: 2023-11-30 23:59:59
period: 1h
basePeriod: 15m
exchanges: [{"eid":"Futures_Binance","currency":"BTC_USDT"}]
*/
//@version=5
// This source code is subject to the terms of the Mozilla Public License 2.0 at https://mozilla.org/MPL/2.0/
// © Coinrule
strategy("Bollinger Band Below Price with RSI",
overlay=true,
initial_capital=1000,
process_orders_on_close=true,
default_qty_type=strategy.percent_of_equity,
default_qty_value=70,
commission_type=strategy.commission.percent,
commission_value=0.1)
showDate = input(defval=true, title='Show Date Range')
timePeriod = time >= timestamp(syminfo.timezone, 2022, 1, 1, 0, 0)
notInTrade = strategy.position_size <= 0
//Bollinger Bands Indicator
length = input.int(20, minval=1)
src = input(close, title="Source")
mult = input.float(2.0, minval=0.001, maxval=50, title="StdDev")
basis = ta.sma(src, length)
dev = mult * ta.stdev(src, length)
upper = basis + dev
lower = basis - dev
offset = input.int(0, "Offset", minval = -500, maxval = 500)
plot(basis, "Basis", color=#FF6D00, offset = offset)
p1 = plot(upper, "Upper", color=#2962FF, offset = offset)
p2 = plot(lower, "Lower", color=#2962FF, offset = offset)
fill(p1, p2, title = "Background", color=color.rgb(33, 150, 243, 95))
// RSI inputs and calculations
lengthRSI = 14
RSI = ta.rsi(close, lengthRSI)
// Configure trail stop level with input options
longTrailPerc = input.float(title='Trail Long Loss (%)', minval=0.0, step=0.1, defval=3) * 0.01
shortTrailPerc = input.float(title='Trail Short Loss (%)', minval=0.0, step=0.1, defval=3) * 0.01
// Determine trail stop loss prices
//longStopPrice = 0.0
shortStopPrice = 0.0
//longStopPrice := if strategy.position_size > 0
//stopValue = close * (1 - longTrailPerc)
//math.max(stopValue, longStopPrice[1])
//else
//0
shortStopPrice := if strategy.position_size < 0
stopValue = close * (1 + shortTrailPerc)
math.min(stopValue, shortStopPrice[1])
else
999999
//Entry and Exit
strategy.entry(id="short", direction=strategy.short, when=ta.crossover(close, upper) and RSI < 70 and timePeriod and notInTrade)
if (ta.crossover(upper, close) and RSI > 70 and timePeriod)
strategy.exit(id='close', limit = shortStopPrice)