RSI 지표를 기반으로 한 크로스 타임프레임 전략

1
Follow
1789
Followers
개요
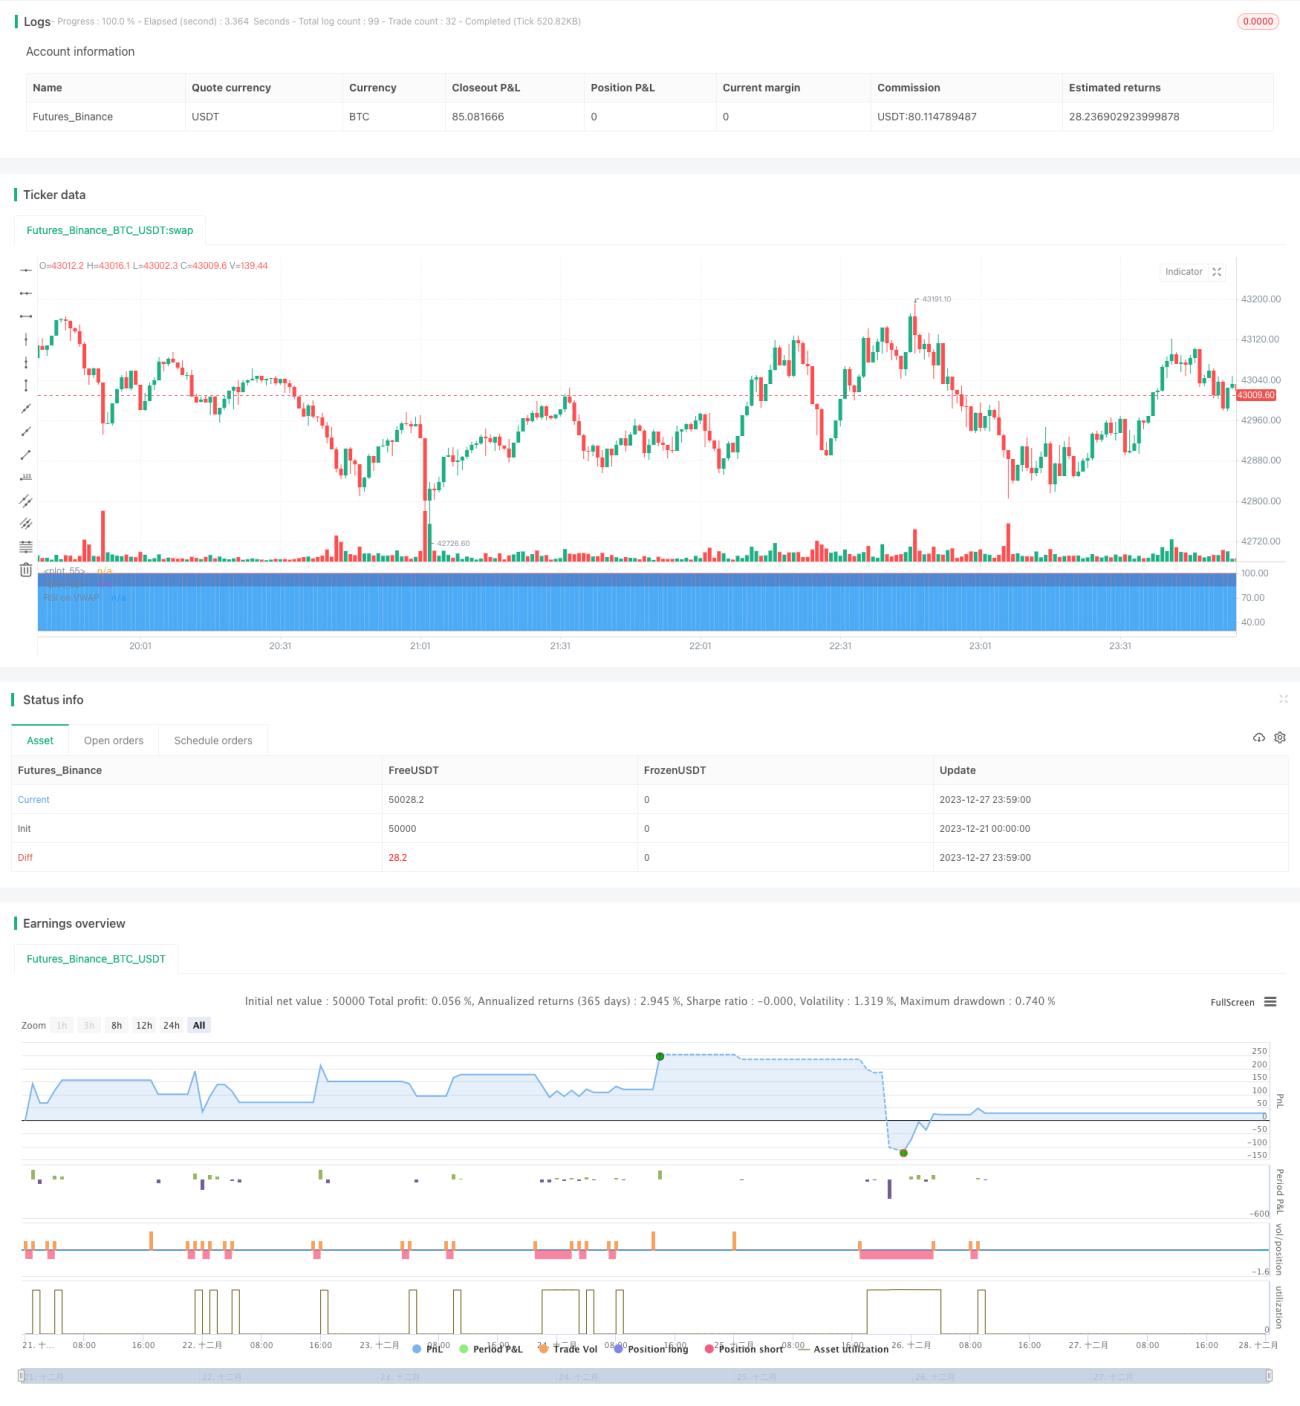
이 전략은 RSI 지표에 기반한 크로스 타임 프레임 BTC 하락 전략이다. 이 전략은 K 라인마다의 거래량 가중 평균 가격 ((VWAP) 을 계산하여 VWAP 곡선을 얻으며 그 곡선에 RSI 지표를 적용한다. RSI 지표가 오버 바이 구역에서 아래로 건너가는 사각지대를 표시하면 BTC 하락한다.
전략 원칙
- 각 K 선의 거래량 중화 평균값 ((VWAP) 을 계산하여 VWAP 곡선을 얻는다.
- VWAP 곡선에 RSI 지표를 적용하여 20 일, 85 초과, 30 초과
- RSI 지표가 상반부 (<85) 에서 상반부 (<30) 를 넘어가면 포지션이 공백됩니다.
- 28 K 라인을 보유한 후, RSI 지표가 다시 오버 소매 라인을 통과하면 ((30)), 평소 포지션
우위 분석
- VWAP를 사용하면 단순한 종결 가격보다는 실제 거래 가격을 반영할 수 있습니다.
- RSI 지표를 적용하여 과매매 현상을 인식하고, 상위와 하위 추격을 피하십시오.
- 시간적 프레임에 따라 작동하여 함정에 빠지지 않도록하십시오.
- 28 K선 손실, 위험 조절
위험과 해결책
- 급격한 물가 상승으로 인한 갑작스러운 사건으로 인해 손실이 막히지 않았습니다.
- 시간적 프레임워크를 활용하여 피지배의 위험을 줄이십시오.
- 잘못된 매개 변수 설정으로 기회를 놓칠 수 있습니다.
- RSI 변수와 오버 바이 오버 셀 라인을 테스트하고 최적화합니다.
- K라인은 슈퍼마켓에 들어갈 수 없습니다.
- 다른 지표의 추세 판단과 결합하여 변수를 유연하게 조정합니다.
최적화 방향
- 더 많은 변수 조합을 테스트하여 최적의 변수를 찾습니다.
- MACD, KD와 같은 다른 지표와 결합하여 과매도 영역에 진입했는지 판단합니다.
- 다양한 품종에 따라 테스트 매개 변수 설정
- 변동율에 따라 중지량을 설정하는 최적화된 중지 메커니즘
요약하다
이 전략은 VWAP와 RSI의 결합을 통해 BTC의 과매매 상태를 식별하고, 시간 프레임 방식으로 작동하여 위험을 효과적으로 제어할 수 있습니다. 전략 아이디어는 명확하고 이해하기 쉽고, 더 많은 테스트를 통해 최적화되어 실제 거래에 적용할 가치가 있습니다.
Source
Pine
/*backtest
start: 2023-12-21 00:00:00
end: 2023-12-28 00:00:00
period: 1m
basePeriod: 1m
exchanges: [{"eid":"Futures_Binance","currency":"BTC_USDT"}]
*/


//@version=4

strategy("Soran Strategy 2 - SHORT SIGNALS", pyramiding=1, initial_capital=1000, default_qty_type=strategy.percent_of_equity, default_qty_value=50, overlay=false)Strategy parameters
Related strategies
Comment
All comments (0)
No data
- 1