개요
이 전략은 다른 시기를 기준으로 하는 지점을 핵심 가격 영역으로 계산하여 금분선 원칙과 결합하여 트렌드 방향을 판단하여 고가와 저가 거래 전략을 실현한다.
전략 원칙
상시 시기의 종식 가격, 최고 가격, 최저 가격의 지점을 계산한다. 클래식 지점과 골드 분할 지점을 포함한다.
가격 돌파 위아래를 기준으로 현재 위치하고 있는 가격 영역을 판단한다. 5개의 구매 영역과 5개의 판매 영역으로 나다.
구매 구역에서 구매 신호를 발송하고 판매 구역에서 판매 신호를 발송하여 높은 가격으로 구매하고 낮은 가격으로 판매하는 전략을 사용하십시오.
우위 분석
시장의 잡음으로 인해 잘못된 추세를 판단하지 않도록 여러 시간 주기를 사용하십시오.
고전 지점과 황금 분할 지점을 결합하여 지점의 신뢰성을 향상시킵니다.
가격 영역을 통해 시장 진입 시기를 판단하여 손실 위험을 최대한 피하십시오.
높은 가격으로 구매하고 낮은 가격으로 판매하는 전략으로 트렌드 트레이딩의 규칙을 따르고 역동적인 트레이딩을 피하십시오.
위험 분석
이 지점의 파열에 주의해야 합니다.
손해 추적이 좋지 않아서 손해가 더 커지는 것을 막아야 합니다.
거래 비용도 최종 수익에 영향을 미칩니다.
최적화 방향
시간주기 변수, 거래 방향 변수 등과 같은 다른 변수를 테스트할 수 있으며, 최적화 전략이다.
다른 지표와 결합하여 트렌드를 파악하여 가짜 브레이크를 방지할 수 있습니다.
단편적 손실을 제어하기 위해 손해 방지 장치를 추가할 수 있습니다.
요약하다
이 전략은 고전적인 기술 분석 방법과 트렌드 거래 전략을 통합하여, 지점 지역을 사용하여 시장 진출 시기를 판단하고, 고 구매 저 판매 원칙을 채택하여 거래 위험을 효과적으로 제어 할 수 있으며, 실장 검증 및 최적화를 할 가치가 있습니다.
/*backtest
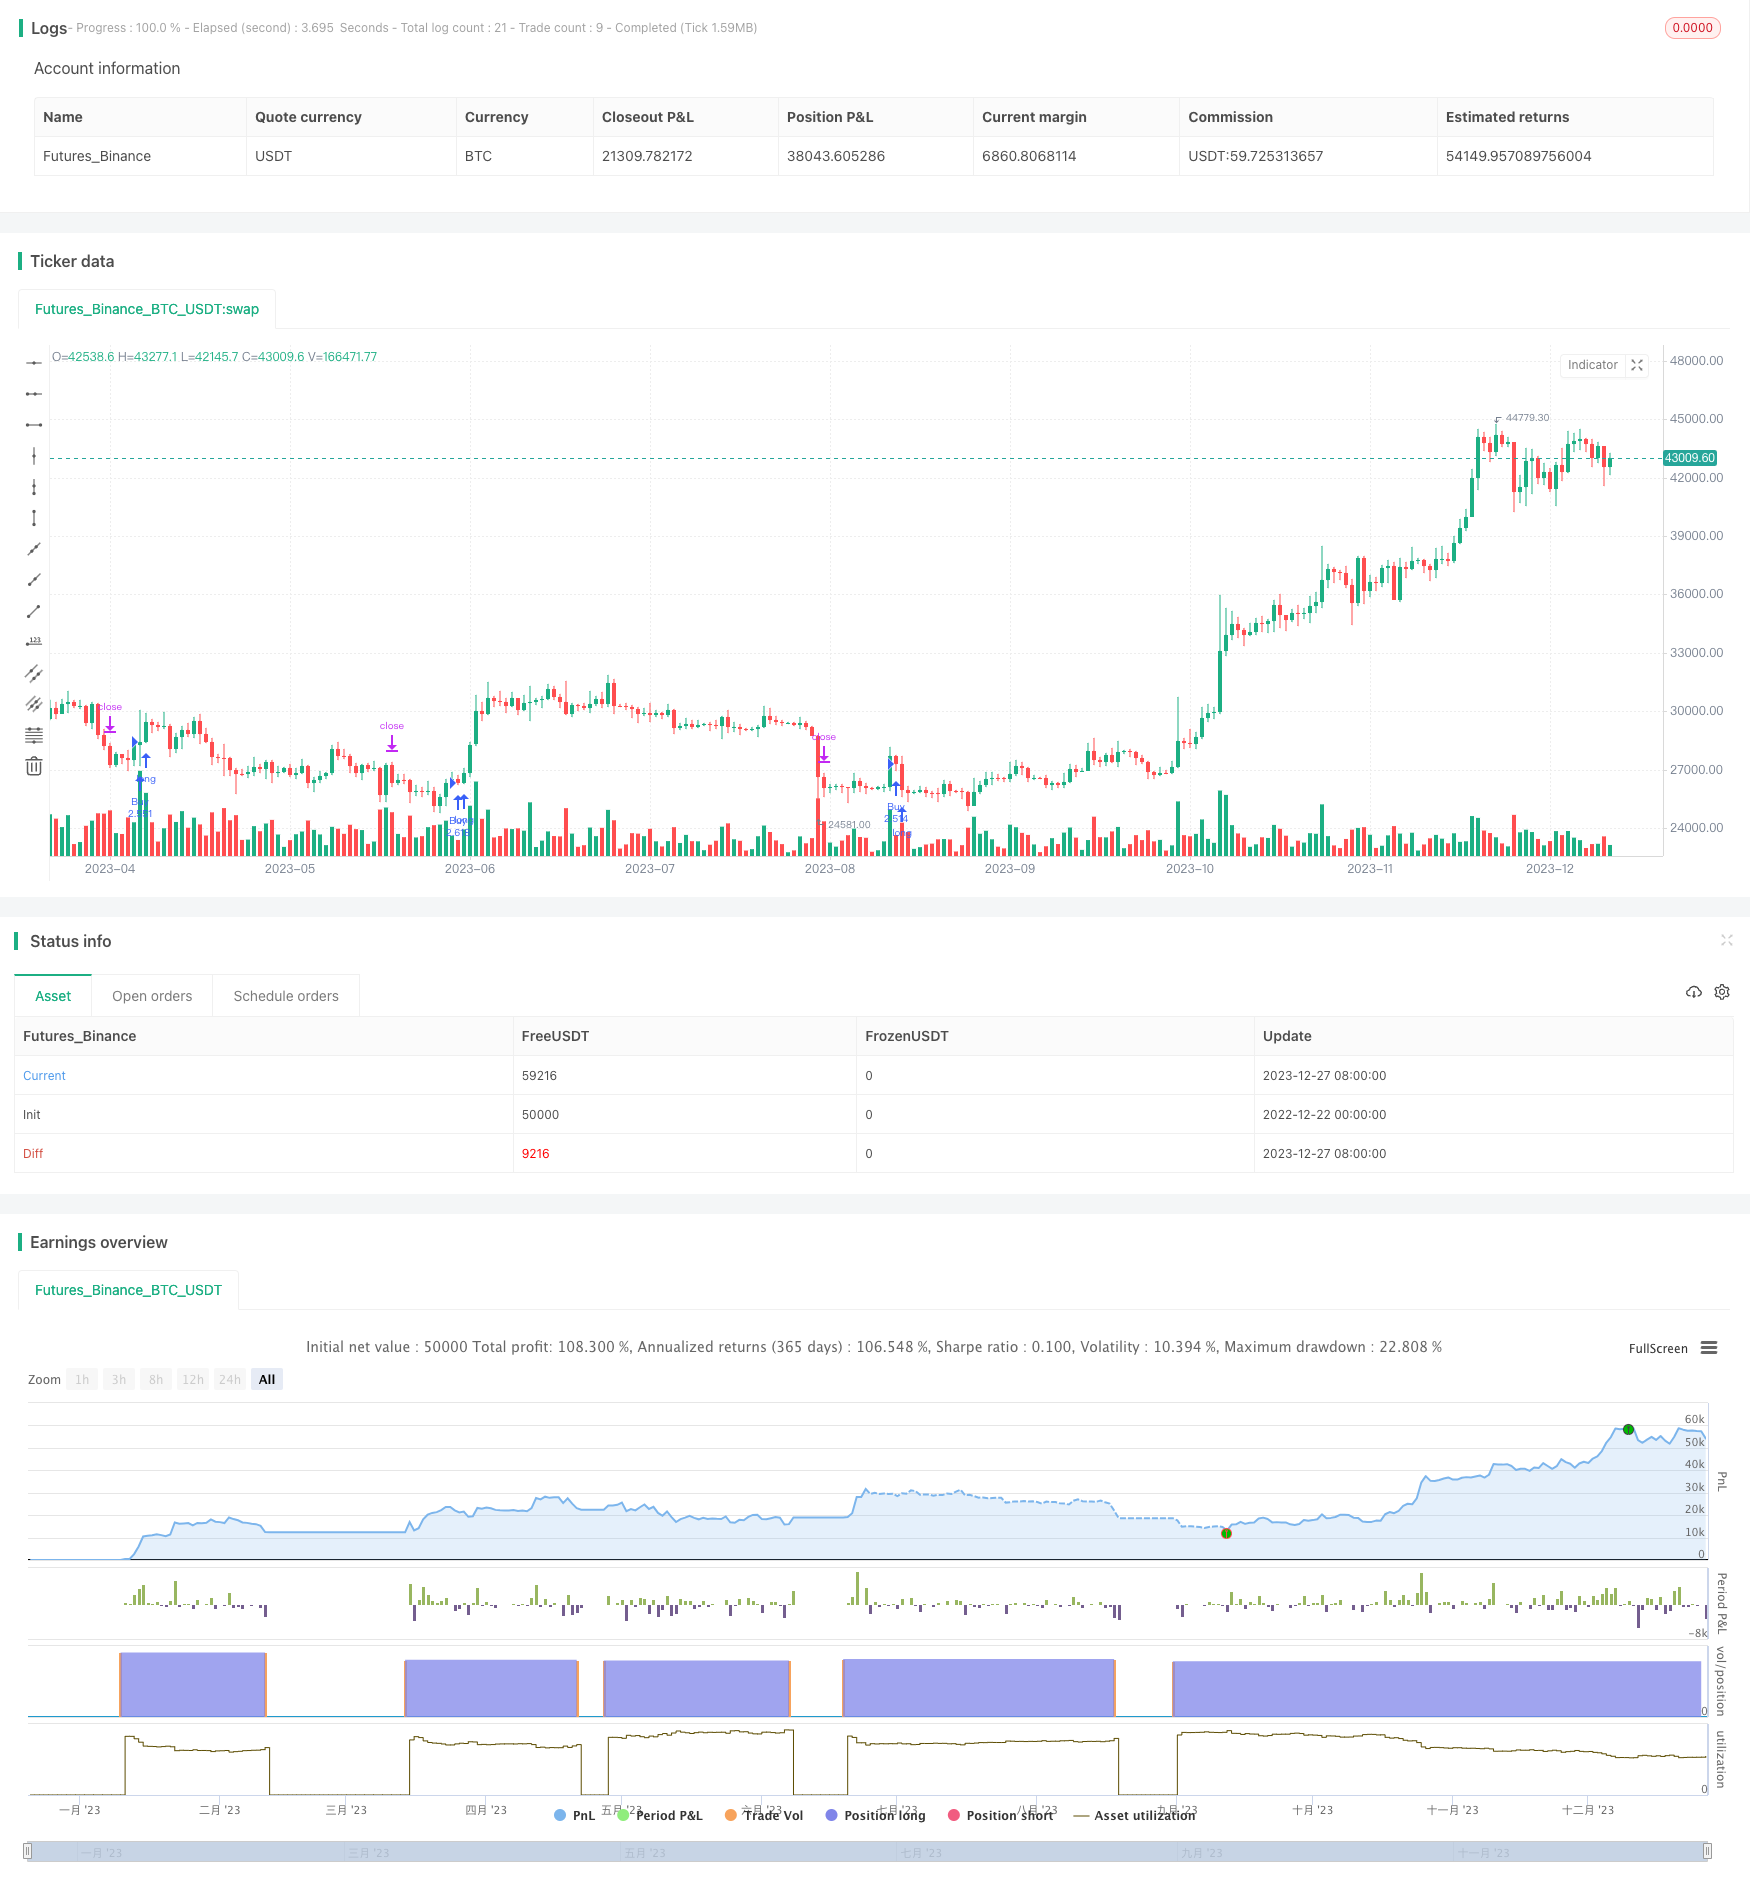
start: 2022-12-22 00:00:00
end: 2023-12-28 00:00:00
period: 1d
basePeriod: 1h
exchanges: [{"eid":"Futures_Binance","currency":"BTC_USDT"}]
*/
// This source code is subject to the terms of the Mozilla Public License 2.0 at https://mozilla.org/MPL/2.0/
// © HeWhoMustNotBeNamed
//@version=4
strategy("BuyHighSellLow - Pivot points", overlay=true, initial_capital = 100000, default_qty_type = strategy.percent_of_equity, default_qty_value = 100, commission_type = strategy.commission.percent, pyramiding = 1, commission_value = 0.01, calc_on_order_fills = true)
Source = input(close)
resolution = input("4D", type=input.resolution)
HTFMultiplier = input(4, title="Higher Timeframe multiplier (Used when resolution is set to Same as Symbol)", minval=2, step=1)
//ppType = input(title="Pivot points type", defval="classic", options=["classic", "fib"])
ppType = "fib"
tradeDirection = input(title="Trade Direction", defval=strategy.direction.long, options=[strategy.direction.all, strategy.direction.long, strategy.direction.short])
backtestBars = input(title="Backtest from ", defval=10, minval=1, maxval=30)
backtestFrom = input(title="Timeframe", defval="years", options=["days", "months", "years"])
hideBands = input(true)
f_multiple_resolution(HTFMultiplier) =>
target_Res_In_Min = timeframe.multiplier * HTFMultiplier * (
timeframe.isseconds ? 1. / 60. :
timeframe.isminutes ? 1. :
timeframe.isdaily ? 1440. :
timeframe.isweekly ? 7. * 24. * 60. :
timeframe.ismonthly ? 30.417 * 24. * 60. : na)
target_Res_In_Min <= 0.0417 ? "1S" :
target_Res_In_Min <= 0.167 ? "5S" :
target_Res_In_Min <= 0.376 ? "15S" :
target_Res_In_Min <= 0.751 ? "30S" :
target_Res_In_Min <= 1440 ? tostring(round(target_Res_In_Min)) :
tostring(round(min(target_Res_In_Min / 1440, 365))) + "D"
f_getBackTestTimeFrom(backtestFrom, backtestBars)=>
byDate = backtestFrom == "days"
byMonth = backtestFrom == "months"
byYear = backtestFrom == "years"
date = dayofmonth(timenow)
mth = month(timenow)
yr = year(timenow)
leapYearDaysInMonth = array.new_int(12,0)
array.set(leapYearDaysInMonth,0,31)
array.set(leapYearDaysInMonth,1,29)
nonleapYearDaysInMonth = array.new_int(12,0)
array.set(leapYearDaysInMonth,0,31)
array.set(leapYearDaysInMonth,1,28)
restMonths = array.new_int(10,0)
array.set(leapYearDaysInMonth,0,31)
array.set(leapYearDaysInMonth,1,30)
array.set(leapYearDaysInMonth,2,31)
array.set(leapYearDaysInMonth,3,30)
array.set(leapYearDaysInMonth,4,31)
array.set(leapYearDaysInMonth,5,31)
array.set(leapYearDaysInMonth,6,30)
array.set(leapYearDaysInMonth,7,31)
array.set(leapYearDaysInMonth,8,30)
array.set(leapYearDaysInMonth,9,31)
array.concat(leapYearDaysInMonth,restMonths)
array.concat(nonleapYearDaysInMonth,restMonths)
isLeapYear = yr % 4 == 0 and (year%100 != 0 or year%400 == 0)
numberOfDaysInCurrentMonth = isLeapYear ? array.get(leapYearDaysInMonth, mth-2) : array.get(nonleapYearDaysInMonth, mth-2)
if(byDate)
mth := (date - backtestBars) < 0 ? mth - 1 : mth
yr := mth < 1 ? yr - 1 : yr
mth := mth < 1 ? 1 : mth
date := (date - backtestBars) < 0 ? numberOfDaysInCurrentMonth - backtestBars + date + 1 : date - backtestBars + 1
if(byMonth)
date := 1
yr := (mth - (backtestBars%12)) < 0 ? yr - int(backtestBars/12) - 1 : yr - int(backtestBars/12)
mth := mth - (backtestBars%12) + 1
if(byYear)
date := 1
mth := 1
yr := yr - backtestBars
[date, mth, yr]
f_secureSecurity(_symbol, _res, _src) => security(_symbol, _res, _src[1], lookahead = barmerge.lookahead_on)
f_getClassicPivots(HIGHprev, LOWprev, CLOSEprev)=>
PP = (HIGHprev + LOWprev + CLOSEprev) / 3
R1 = PP * 2 - LOWprev
S1 = PP * 2 - HIGHprev
R2 = PP + (HIGHprev - LOWprev)
S2 = PP - (HIGHprev - LOWprev)
R3 = PP * 2 + (HIGHprev - 2 * LOWprev)
S3 = PP * 2 - (2 * HIGHprev - LOWprev)
R4 = PP * 3 + (HIGHprev - 3 * LOWprev)
S4 = PP * 3 - (3 * HIGHprev - LOWprev)
R5 = PP * 4 + (HIGHprev - 4 * LOWprev)
S5 = PP * 4 - (4 * HIGHprev - LOWprev)
[R5, R4, R3, R2, R1, PP, S1, S2, S3, S4, S5]
f_getFibPivots(HIGHprev, LOWprev, CLOSEprev)=>
PP = (HIGHprev + LOWprev + CLOSEprev) / 3
R1 = PP + 0.382 * (HIGHprev - LOWprev)
S1 = PP - 0.382 * (HIGHprev - LOWprev)
R2 = PP + 0.618 * (HIGHprev - LOWprev)
S2 = PP - 0.618 * (HIGHprev - LOWprev)
R3 = PP + (HIGHprev - LOWprev)
S3 = PP - (HIGHprev - LOWprev)
R4 = PP + 1.41 * (HIGHprev - LOWprev)
S4 = PP - 1.41 * (HIGHprev - LOWprev)
R5 = PP + 1.65 * (HIGHprev - LOWprev)
S5 = PP - 1.65 * (HIGHprev - LOWprev)
[R5, R4, R3, R2, R1, PP, S1, S2, S3, S4, S5]
f_getPivotPoints(HTFMultiplier, resolution, ppType)=>
derivedResolution = resolution == ""? f_multiple_resolution(HTFMultiplier) : resolution
HIGHprev = f_secureSecurity(syminfo.tickerid, derivedResolution, high)
LOWprev = f_secureSecurity(syminfo.tickerid, derivedResolution, low)
CLOSEprev = f_secureSecurity(syminfo.tickerid, derivedResolution, close)
[R5, R4, R3, R2, R1, PP, S1, S2, S3, S4, S5] = f_getClassicPivots(HIGHprev, LOWprev, CLOSEprev)
[Rf5, Rf4, Rf3, Rf2, Rf1, PPf, Sf1, Sf2, Sf3, Sf4, Sf5] = f_getFibPivots(HIGHprev, LOWprev, CLOSEprev)
[R5, R4, R3, R2, R1, PP, S1, S2, S3, S4, S5]
f_getState(Source, R5, R4, R3, R2, R1, PP, S1, S2, S3, S4, S5)=>
state =
Source > R5 ? 5 :
Source > R4 ? 4 :
Source > R3 ? 3 :
Source > R2 ? 2 :
Source > R1 ? 1 :
Source > PP ? 0 :
Source > S1 ? -1 :
Source > S2 ? -2 :
Source > S3 ? -3 :
Source > S4 ? -4 :
Source > S5 ? -5 : -6
state
[R5, R4, R3, R2, R1, PP, S1, S2, S3, S4, S5] = f_getPivotPoints(HTFMultiplier, resolution, ppType)
[date, mth, yr] = f_getBackTestTimeFrom(backtestFrom, backtestBars)
inDateRange = time >= timestamp(syminfo.timezone, yr, mth, date, 0, 0)
BBU5 = plot(not hideBands ? R5: na, title="R5", color=color.orange, linewidth=1, transp=50, style=plot.style_linebr)
BBU4 = plot(not hideBands ? R4: na, title="R4", color=color.yellow, linewidth=1, transp=50, style=plot.style_linebr)
BBU3 = plot(not hideBands ? R3: na, title="R3", color=color.navy, linewidth=1, transp=50, style=plot.style_linebr)
BBU2 = plot(not hideBands ? R2: na, title="R2", color=color.olive, linewidth=1, transp=50, style=plot.style_linebr)
BBU1 = plot(not hideBands ? R1: na, title="R1", color=color.lime, linewidth=1, transp=50, style=plot.style_linebr)
BBM4 = plot(not hideBands ? PP:na, title="PP", color=color.black, linewidth=2, style=plot.style_linebr)
BBL1 = plot(not hideBands ? S1: na, title="S1", color=color.lime, linewidth=1, transp=50, style=plot.style_linebr)
BBL2 = plot(not hideBands ? S2: na, title="S2", color=color.olive, linewidth=1, transp=50, style=plot.style_linebr)
BBL3 = plot(not hideBands ? S3: na, title="S3", color=color.navy, linewidth=1, transp=50, style=plot.style_linebr)
BBL4 = plot(not hideBands ? S4: na, title="S4", color=color.yellow, linewidth=1, transp=50, style=plot.style_linebr)
BBL5 = plot(not hideBands ? S5: na, title="S5", color=color.orange, linewidth=1, transp=50, style=plot.style_linebr)
fill(BBU5, BBU4, title="RZ5", color=color.green, transp=90)
fill(BBU4, BBU3, title="RZ4", color=color.lime, transp=90)
fill(BBU3, BBU2, title="RZ3", color=color.olive, transp=90)
fill(BBU2, BBU1, title="RZ2", color=color.navy, transp=90)
fill(BBU1, BBM4, title="RZ1", color=color.yellow, transp=90)
fill(BBM4, BBL1, title="SZ1", color=color.orange, transp=90)
fill(BBL1, BBL2, title="SZ2", color=color.red, transp=90)
fill(BBL2, BBL3, title="SZ3", color=color.maroon, transp=90)
fill(BBL3, BBL4, title="SZ4", color=color.maroon, transp=90)
fill(BBL4, BBL5, title="SZ5", color=color.maroon, transp=90)
strategy.risk.allow_entry_in(tradeDirection)
longCondition = crossover(Source[1],R1) and inDateRange
shortCondition = crossunder(Source[1], S2) and inDateRange
strategy.entry("Buy", strategy.long, when=longCondition, oca_name="oca")
strategy.entry("Sell", strategy.short, when=shortCondition, oca_name="oca")