개요
이 전략은 간단한 평균선 교차와 평균 실제 파장 지표를 사용하여 구매 및 판매 신호를 생성합니다. 이것은 트렌드 추적 방식의 전략입니다. 주로 50 일 평균선과 100 일 평균선의 교차를 사용하여 트렌드를 판단하고 ATR 지표를 사용하여 스톱 스포트 포인트를 설정하여 위험을 제어합니다.
전략 원칙
- 50일 간소 이동 평균 SMA1 및 100일 간소 이동 평균 SMA2를 계산합니다.
- SMA1 위에 SMA2를 뚫을 때, 구매 신호가 발송됩니다. SMA1 아래 SMA2를 뚫을 때, 판매 신호가 발송됩니다.
- 14일 ATR을 계산합니다.
- ATR 곱하기 설정된 곱하기
- 구매 신호를 발신할 때, 매매 시점으로 매매 시점으로 매매 시점으로 매매 시점으로 매매 시점으로 매매 시점으로 매매 시점으로 매매 시점으로 매매 시점으로 매매 시점으로 매매 시점으로 매매 시점으로 매매 시점으로 매매 시점으로 매매 시점으로 매매 시점으로 매매 시점으로 매매 시점으로 매매 시점으로 매매 시점으로 매매 시점으로 매매 시점으로 매매 시점으로 매매 시점으로 매매 시점으로 매매 시점으로 매매 시점으로 매매 시점으로 매매 시점으로 매매 시점으로 매매 시점으로 매매 시점으로 매매 시점으로 매매 시점으로 매매 시점으로 매매 시점으로 매매 시점으로 매매 시점으로 매매 시점으로 매매 시점으로 매매 시점으로 매매 시점으로 매매 시점으로 매매 시점으로 매매 시점으로 매매 시점으로 매매 시점으로 매매 시점으로 매점으로 매출 시점
보시다시피, 이 전략은 주로 일률적인 경향 판단 능력과 ATR 지표의 위험 제어 능력에 의존한다. 기본 원칙은 간단하고 명확하며 이해하기 쉽고 구현된다.
전략적 이점
- “이 모든 것은 매우 명확하고 쉽게 실행할 수 있습니다.
- 평균선을 사용하여 주 트렌드를 판단하여 트렌드를 효과적으로 추적할 수 있습니다.
- ATR 제약은 개별적인 대지진으로 인한 피해를 효과적으로 통제할 수 있다.
- 다른 시장 환경에 따라 쉽게 조정할 수 있는 매개 변수
전략적 위험
- 진동상태에서, 평행선은 많은 가짜 신호를 생성하고, 반전 지점을 놓치는 것이 쉽다.
- ATR 지표는 시장의 급격한 변화에 민감하지 않아 예상보다 더 큰 손실을 초래할 수 있습니다.
- 지표 변수와 ATR 곱수의 설정은 경험에 의존하며, 잘못 설정하면 정책 성능에 영향을 줄 수 있습니다.
- 이중 평행선이 그 자체로 지연되어 있어 전환점을 놓칠 수도 있다.
위험 관리 방법:
- 평균주기를 적절히 단축하여 지표를 더 민감하게 만듭니다.
- 동적으로 ATR의 곱수를 조정하여 손해배상 유연성을 제공합니다.
- 다른 지표와 함께 가짜 신호를 필터링
- 큰 수준의 구조적 판단에 기반하여 작동
전략 최적화 방향
- 지수 이동 평균과 같은 다른 종류의 평균을 시도해 보세요.
- ATR은 Keltner 통로와 같은 동적 중지 방식을 대체하는 것을 고려할 수 있다
- 거래량 증가와 같은 보조 지표 필터링 신호
- 파동 이론과 지지 저항 지점과 같은 추세 요점을 결정하는
요약하다
이 전략은 전형적인 트렌드 추적 전략에 속하며, 평균선 판단 트렌드 방향, ATR 설정 중지 손실을 사용하여 위험을 제어합니다. 원칙은 간단하고 명확하며, 쉽게 파악할 수 있습니다. 그러나 약간의 지연과 잘못된 신호 위험이 있지만, 매개 변수 조정, 지표 최적화, 더 많은 요소를 결합하는 방법을 통해 전략을 더 잘 적응시킬 수 있습니다.
전략 소스 코드
/*backtest
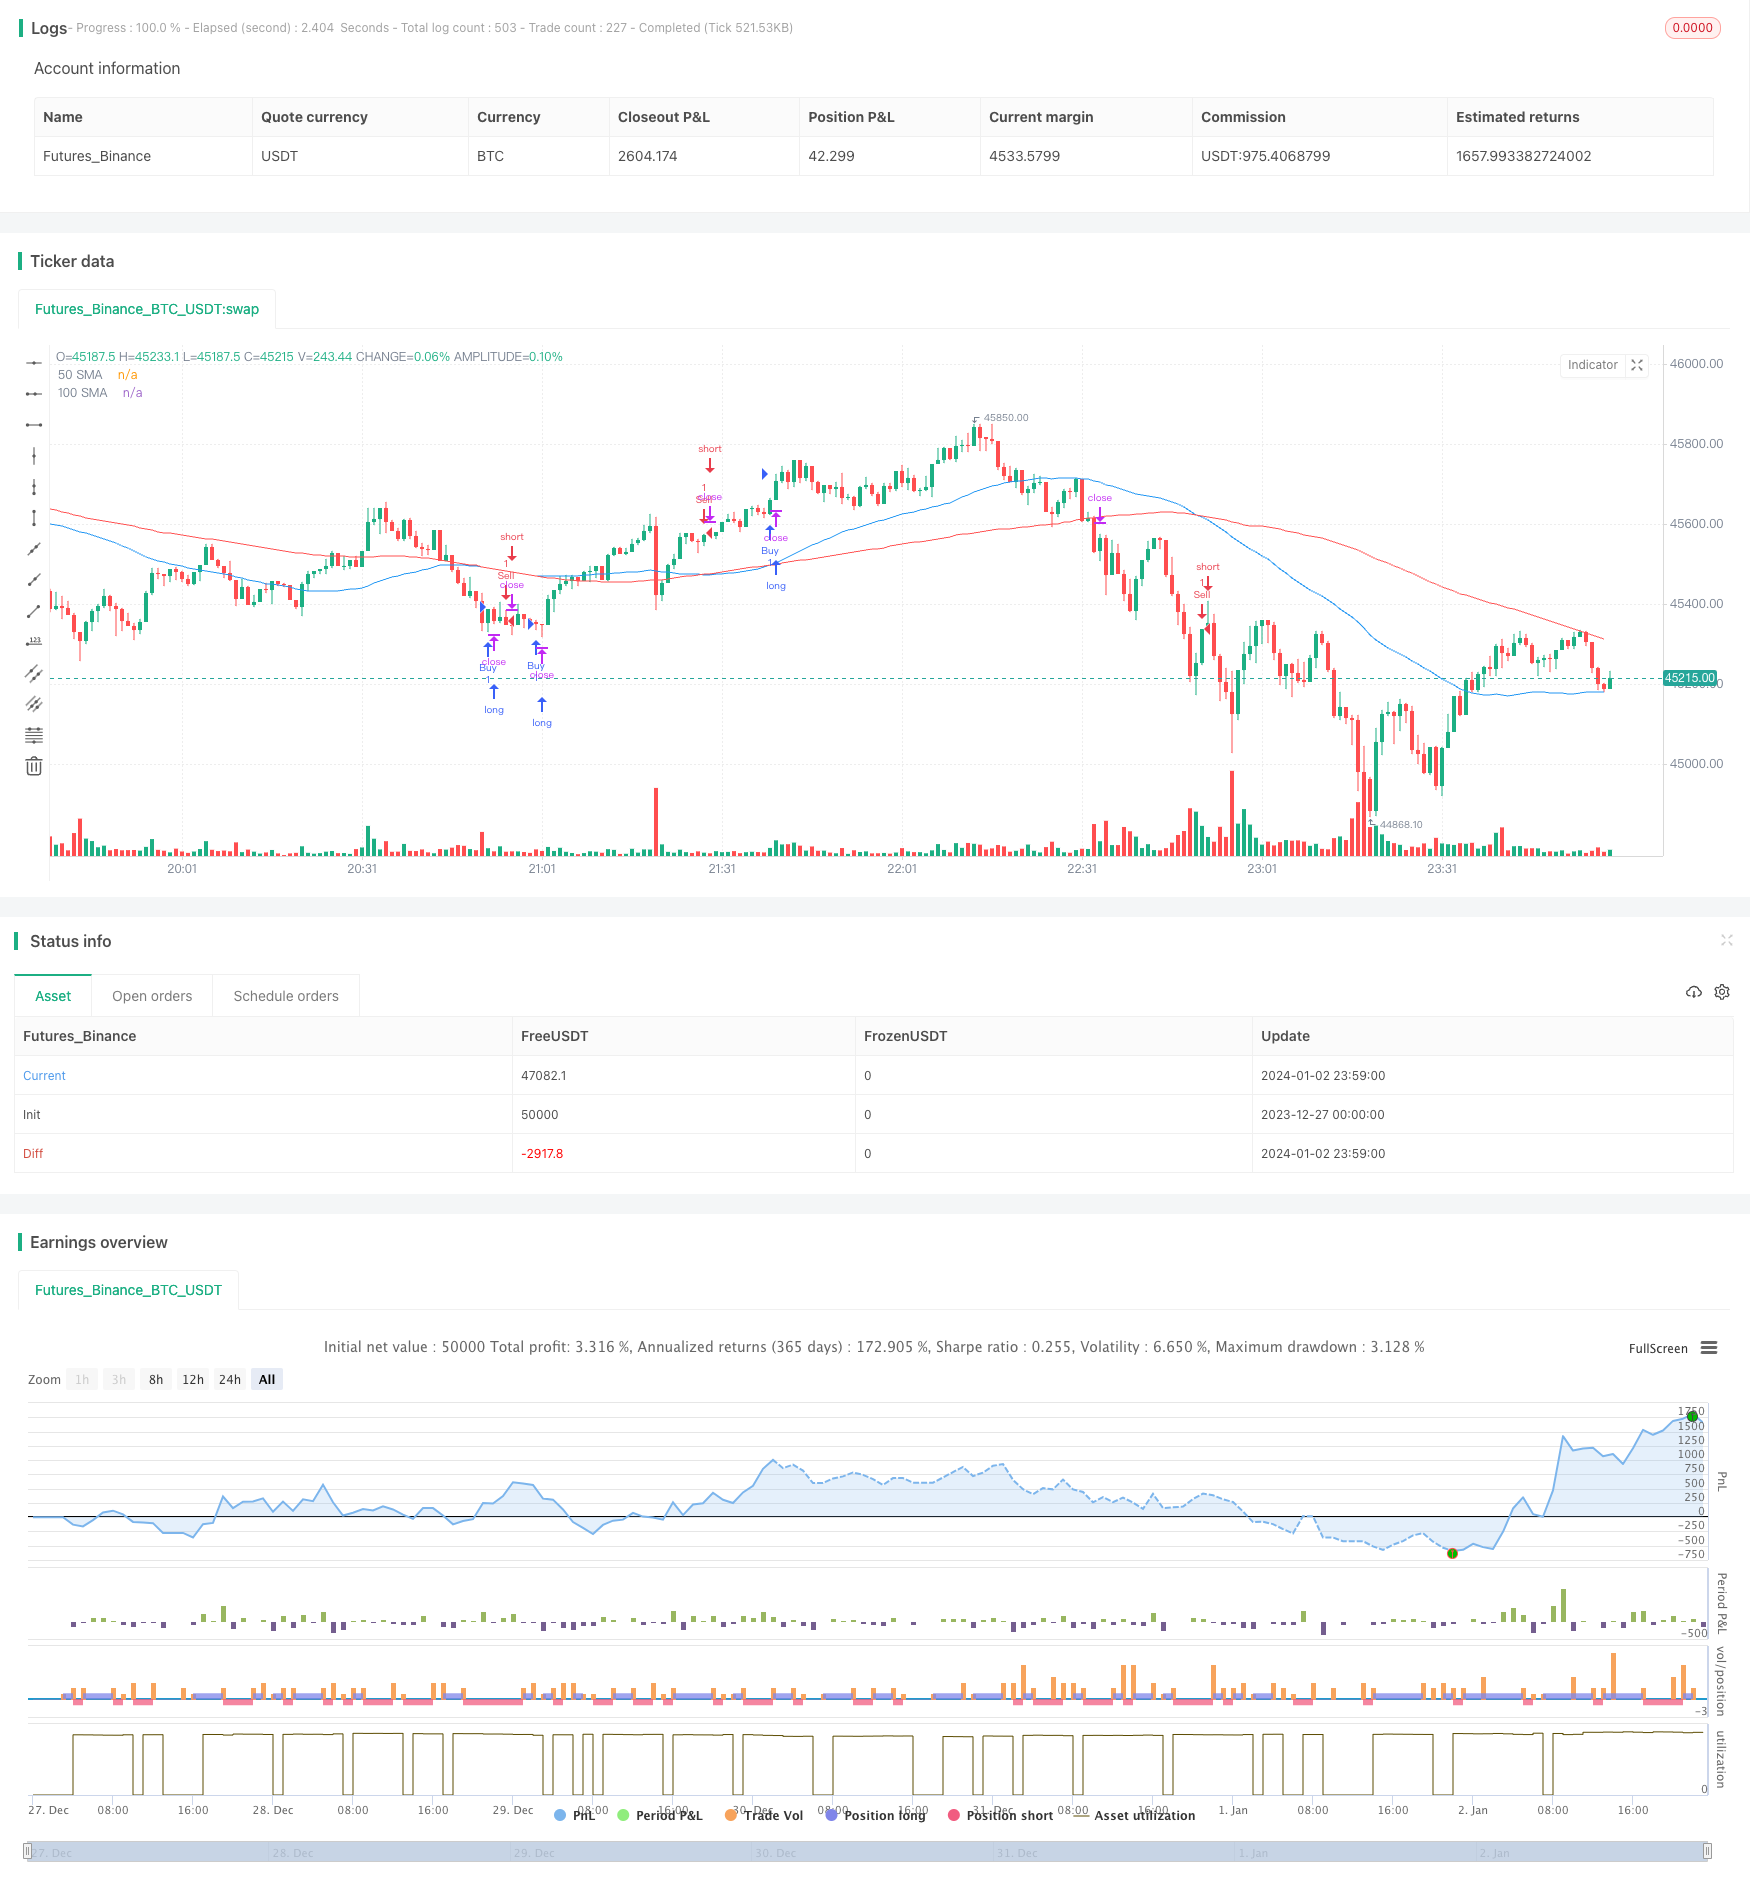
start: 2023-12-27 00:00:00
end: 2024-01-03 00:00:00
period: 1m
basePeriod: 1m
exchanges: [{"eid":"Futures_Binance","currency":"BTC_USDT"}]
*/
//@version=5
strategy("SMA and ATR Strategy", overlay=true)
// Step 1. Define strategy settings
lengthSMA1 = input.int(50, title="50 SMA Length")
lengthSMA2 = input.int(100, title="100 SMA Length")
atrLength = input.int(14, title="ATR Length")
atrMultiplier = input.int(4, title="ATR Multiplier")
// Step 2. Calculate strategy values
sma1 = ta.sma(close, lengthSMA1)
sma2 = ta.sma(close, lengthSMA2)
atr = ta.atr(atrLength)
// Step 3. Output strategy data
plot(sma1, color=color.blue, title="50 SMA")
plot(sma2, color=color.red, title="100 SMA")
// Step 4. Determine trading conditions
longCondition = ta.crossover(sma1, sma2)
shortCondition = ta.crossunder(sma1, sma2)
longStopLoss = close - (atr * atrMultiplier)
shortStopLoss = close + (atr * atrMultiplier)
// Step 5. Execute trades based on conditions
if (longCondition)
strategy.entry("Buy", strategy.long)
strategy.exit("Sell", "Buy", stop=longStopLoss)
if (shortCondition)
strategy.entry("Sell", strategy.short)
strategy.exit("Buy", "Sell", stop=shortStopLoss)