개요
이 전략은 램프 지표를 사용하여 가격 돌파의 방향과 강도를 결정하여 구매 및 판매 신호를 생성합니다. 그것은 구매 작업을 수행합니다.
전략 원칙
이 전략은 램프 지표를 기반으로 하며, 램프 지표는 가격의 최고 가격, 최저 가격, 그리고 평균 실제 변동의 폭에 따라 스톱 라인을 설정한다. 구체적으로, 이 전략은 22 일 동안의 평균 실제 변동의 폭을 계산하고, 한 계수 (( implicitly 3)) 로 곱한다. 그리고는 이 수에 따라 긴 라인 스톱 라인과 짧은 라인 스톱 라인을 설정한다. 이 전략은 다단위 포지션을 보유할 때, 가격이 긴 라인 스톱 라인을 넘어간다면 판매 신호를 발생시키고, 빈 상위 포지션이 짧은 라인 스톱 라인을 넘어간다면 구매 신호를 발생시킨다.
이 전략은 단지 구매하는 작업을 수행한다. 구체적으로, 그것은 가격이 마지막 긴 라인 스톱 라인을 돌파 할 때 구매 신호를 생성한다. 그리고 가격이 짧은 라인 스톱 라인을 넘어갈 때 판매 신호를 생성하고 청산한다.
우위 분석
- 램프 지표를 사용하여 동적으로 설정된 정지 손해 라인을 사용하여 위험을 효과적으로 제어할 수 있습니다.
- 가격 돌파구와 결합하여 거래 신호를 생성하여 가격의 추세를 잡을 수 있습니다.
- 구매만 하는 전략으로, 양쪽의 역동성을 피할 수 있습니다.
- 다중 조건으로 트리거되는 Alert를 설정하여 정책의 상태를 실시간으로 모니터링할 수 있습니다.
위험 분석
- 램프 지표는 변동의 규모에 민감하며, 비정상적인 가격 변동이 발생하면 잘못된 신호를 보낼 수 있습니다.
- 매입 후에도 스톱로스를 설정하지 않고 손실 위험을 효과적으로 통제할 수 없습니다.
- 이윤을 고정할 수 없는 ‘정지’를 추적하지 않는다.
위험 해결 방법:
- 다른 지표와 함께 신호를 필터링하여 잘못된 정보를 방지합니다.
- 최대 손실 비율을 제한하는 스톱 라인을 설정합니다.
- 추적 중지 메커니즘을 추가하여 동적으로 조정할 수 있습니다.
최적화 방향
- 다른 변수 설정을 테스트하여 구매 및 판매 시점을 최적화 할 수 있습니다.
- 잘못된 신호를 방지하기 위해 다른 지표를 추가할 수 있는 확인
- 구매와 판매를 동시에 고려할 수 있습니다.
- 손해 방지 및 정지 장치를 설정할 수 있습니다.
요약하다
이 전략은 램프 지표의 동적 정지선으로 가격 반전의 기회를 식별한다. 그것은 가격이 상향으로 긴 정지선을 돌파했을 때만 구매하고, 가격이 짧은 정지선을 넘어갔을 때만 판매하며, 일방적인 동작을 구현하고, 양쪽 끝의 역전 상황을 회피하는 간단한 전략을 구현한다. 이 전략은 위험을 효과적으로 제어하지만, 중지 및 중지 설정은 없다. 우리는 다른 지표 필터링과 중지 중지 설정을 추가하여 전략을 최적화하여 더 안정적으로 만들 수 있다.
전략 소스 코드
/*backtest
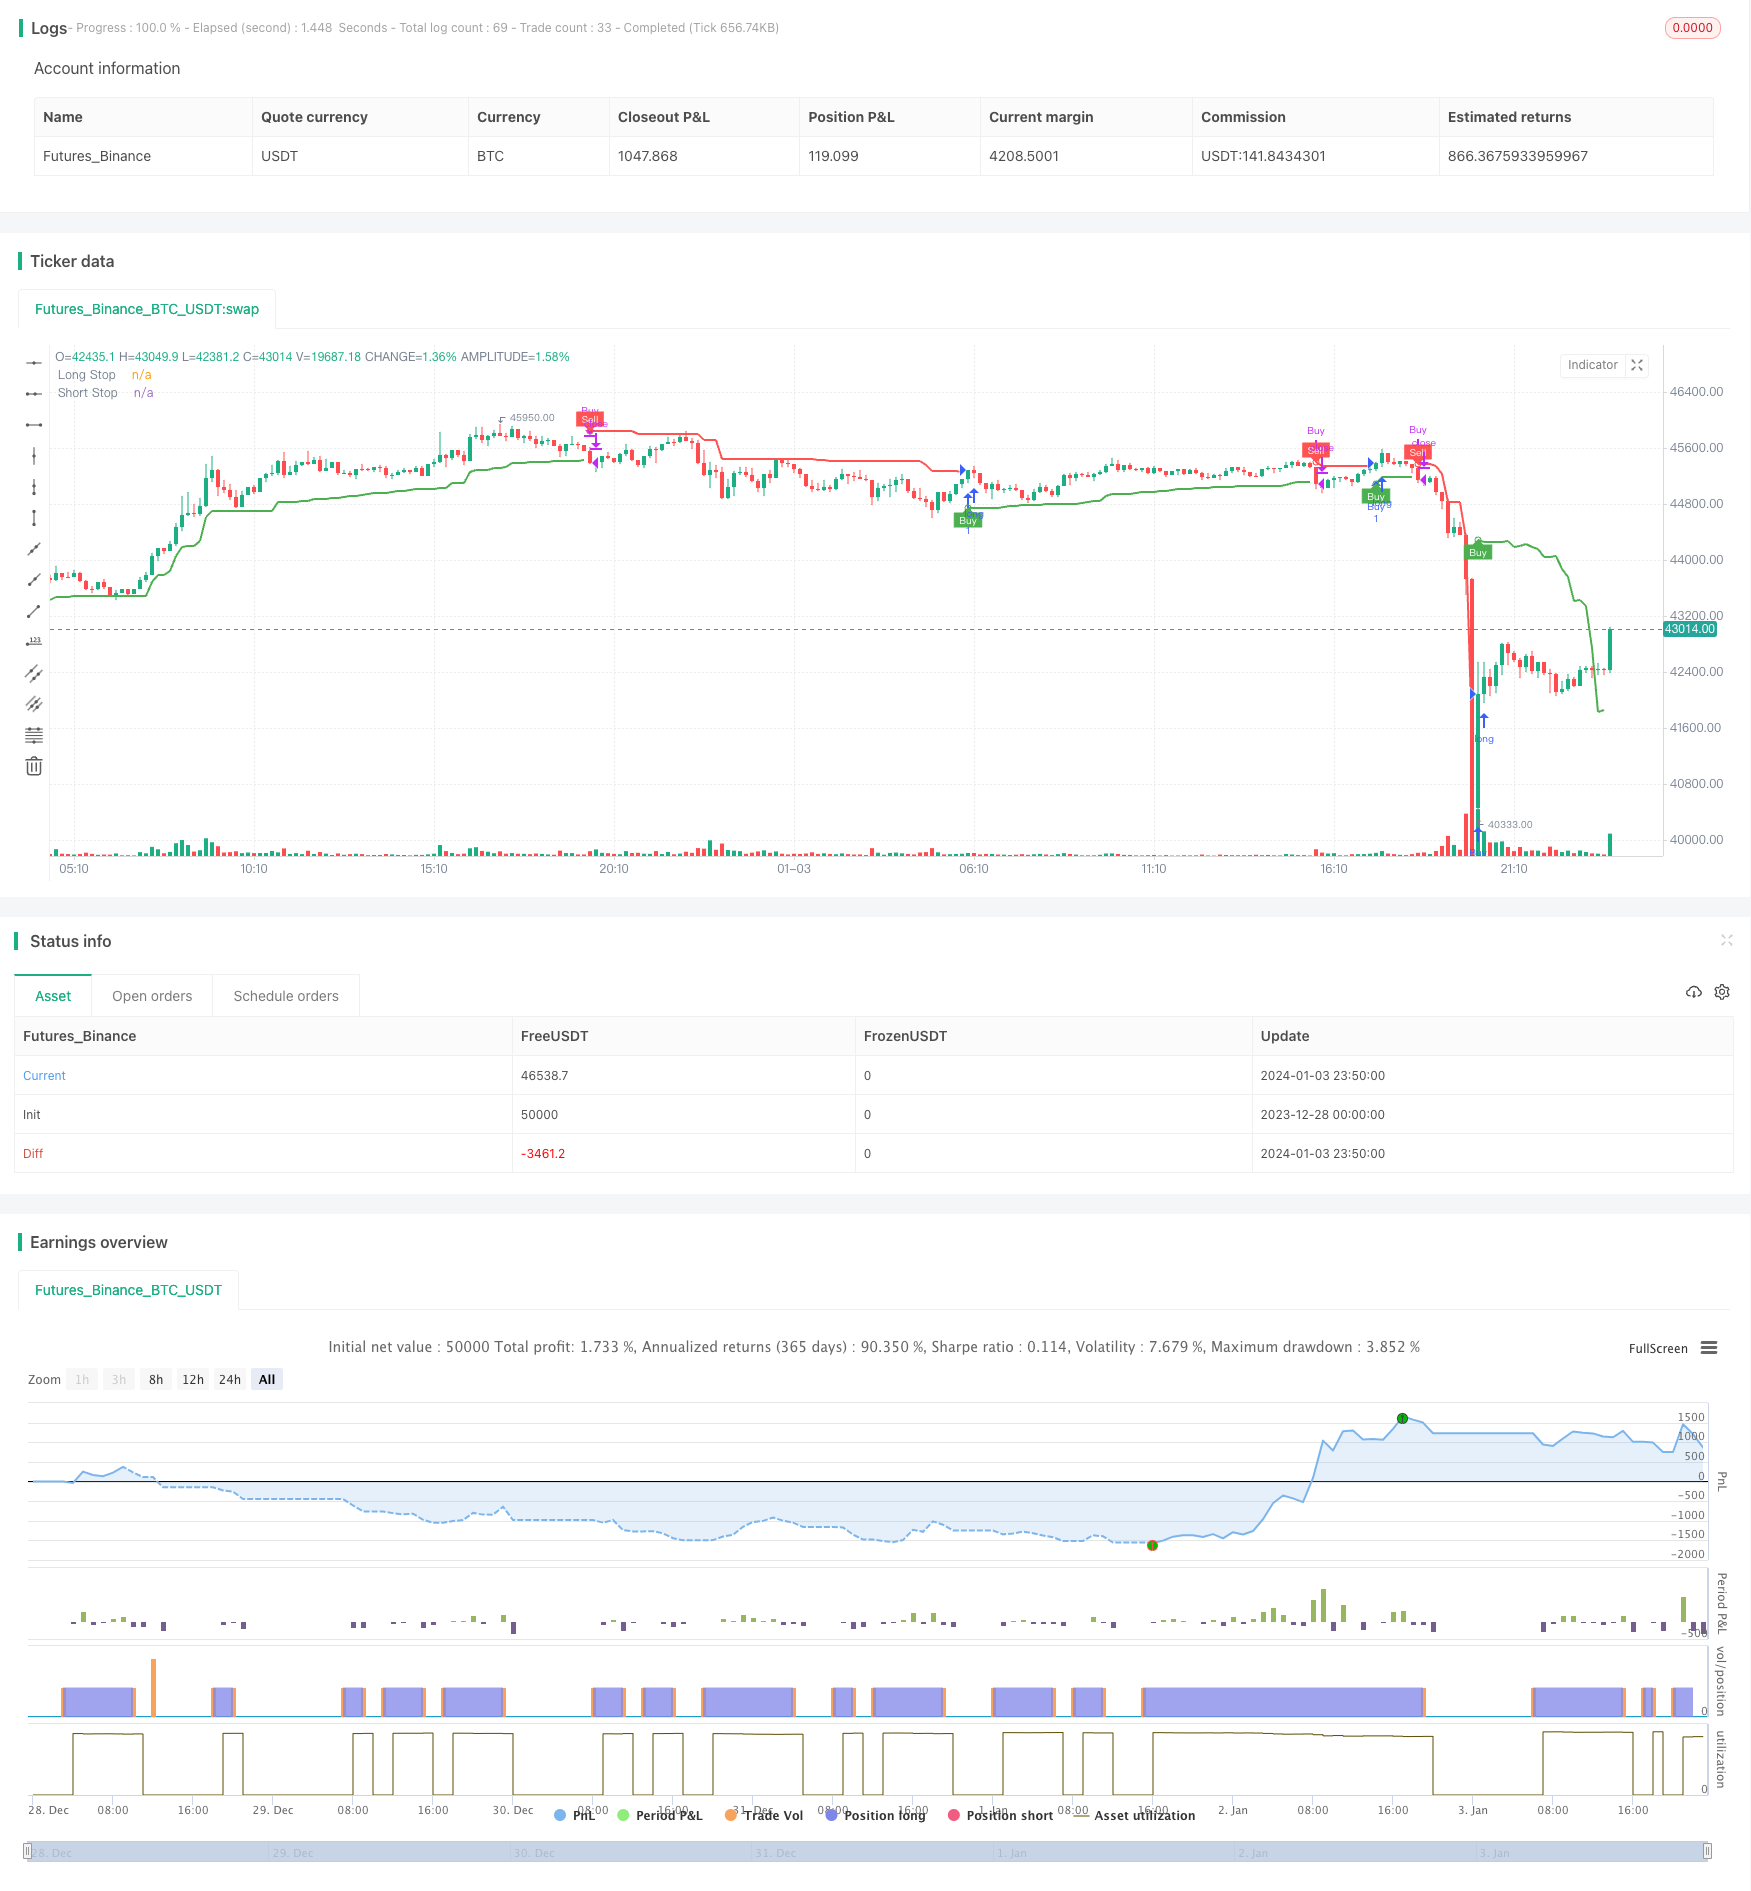
start: 2023-12-28 00:00:00
end: 2024-01-04 00:00:00
period: 10m
basePeriod: 1m
exchanges: [{"eid":"Futures_Binance","currency":"BTC_USDT"}]
*/
//@version=5
strategy("Chandelier Exit Strategy", overlay=true)
length = input(title='ATR Period', defval=22)
mult = input.float(title='ATR Multiplier', step=0.1, defval=3.0)
showLabels = input(title='Show Buy/Sell Labels ?', defval=true)
useClose = input(title='Use Close Price for Extremums ?', defval=true)
highlightState = input(title='Highlight State ?', defval=true)
atr = mult * ta.atr(length)
longStop = (useClose ? ta.highest(close, length) : ta.highest(length)) - atr
longStopPrev = nz(longStop[1], longStop)
longStop := close[1] > longStopPrev ? math.max(longStop, longStopPrev) : longStop
shortStop = (useClose ? ta.lowest(close, length) : ta.lowest(length)) + atr
shortStopPrev = nz(shortStop[1], shortStop)
shortStop := close[1] < shortStopPrev ? math.min(shortStop, shortStopPrev) : shortStop
var int dir = 1
dir := close > shortStopPrev ? 1 : close < longStopPrev ? -1 : dir
var color longColor = color.green
var color shortColor = color.red
longStopPlot = plot(dir == 1 ? longStop : na, title='Long Stop', style=plot.style_linebr, linewidth=2, color=color.new(longColor, 0))
buySignal = dir == 1 and dir[1] == -1
plotshape(buySignal ? longStop : na, title='Long Stop Start', location=location.absolute, style=shape.circle, size=size.tiny, color=color.new(longColor, 0))
plotshape(buySignal and showLabels ? longStop : na, title='Buy Label', text='Buy', location=location.absolute, style=shape.labelup, size=size.tiny, color=color.new(longColor, 0), textcolor=color.new(color.white, 0))
shortStopPlot = plot(dir == 1 ? na : shortStop, title='Short Stop', style=plot.style_linebr, linewidth=2, color=color.new(shortColor, 0))
sellSignal = dir == -1 and dir[1] == 1
plotshape(sellSignal ? shortStop : na, title='Short Stop Start', location=location.absolute, style=shape.circle, size=size.tiny, color=color.new(shortColor, 0))
plotshape(sellSignal and showLabels ? shortStop : na, title='Sell Label', text='Sell', location=location.absolute, style=shape.labeldown, size=size.tiny, color=color.new(shortColor, 0), textcolor=color.new(color.white, 0))
changeCond = dir != dir[1]
alertcondition(changeCond, title='Alert: CE Direction Change', message='Chandelier Exit has changed direction!')
alertcondition(buySignal, title='Alert: CE Buy', message='Chandelier Exit Buy!')
alertcondition(sellSignal, title='Alert: CE Sell', message='Chandelier Exit Sell!')
// Define initial capital
initial_capital =25
// Trigger buy order and close buy order on sell signal
if buySignal
strategy.entry("Buy", strategy.long, qty = initial_capital / close)
if sellSignal
strategy.close("Buy")