개요
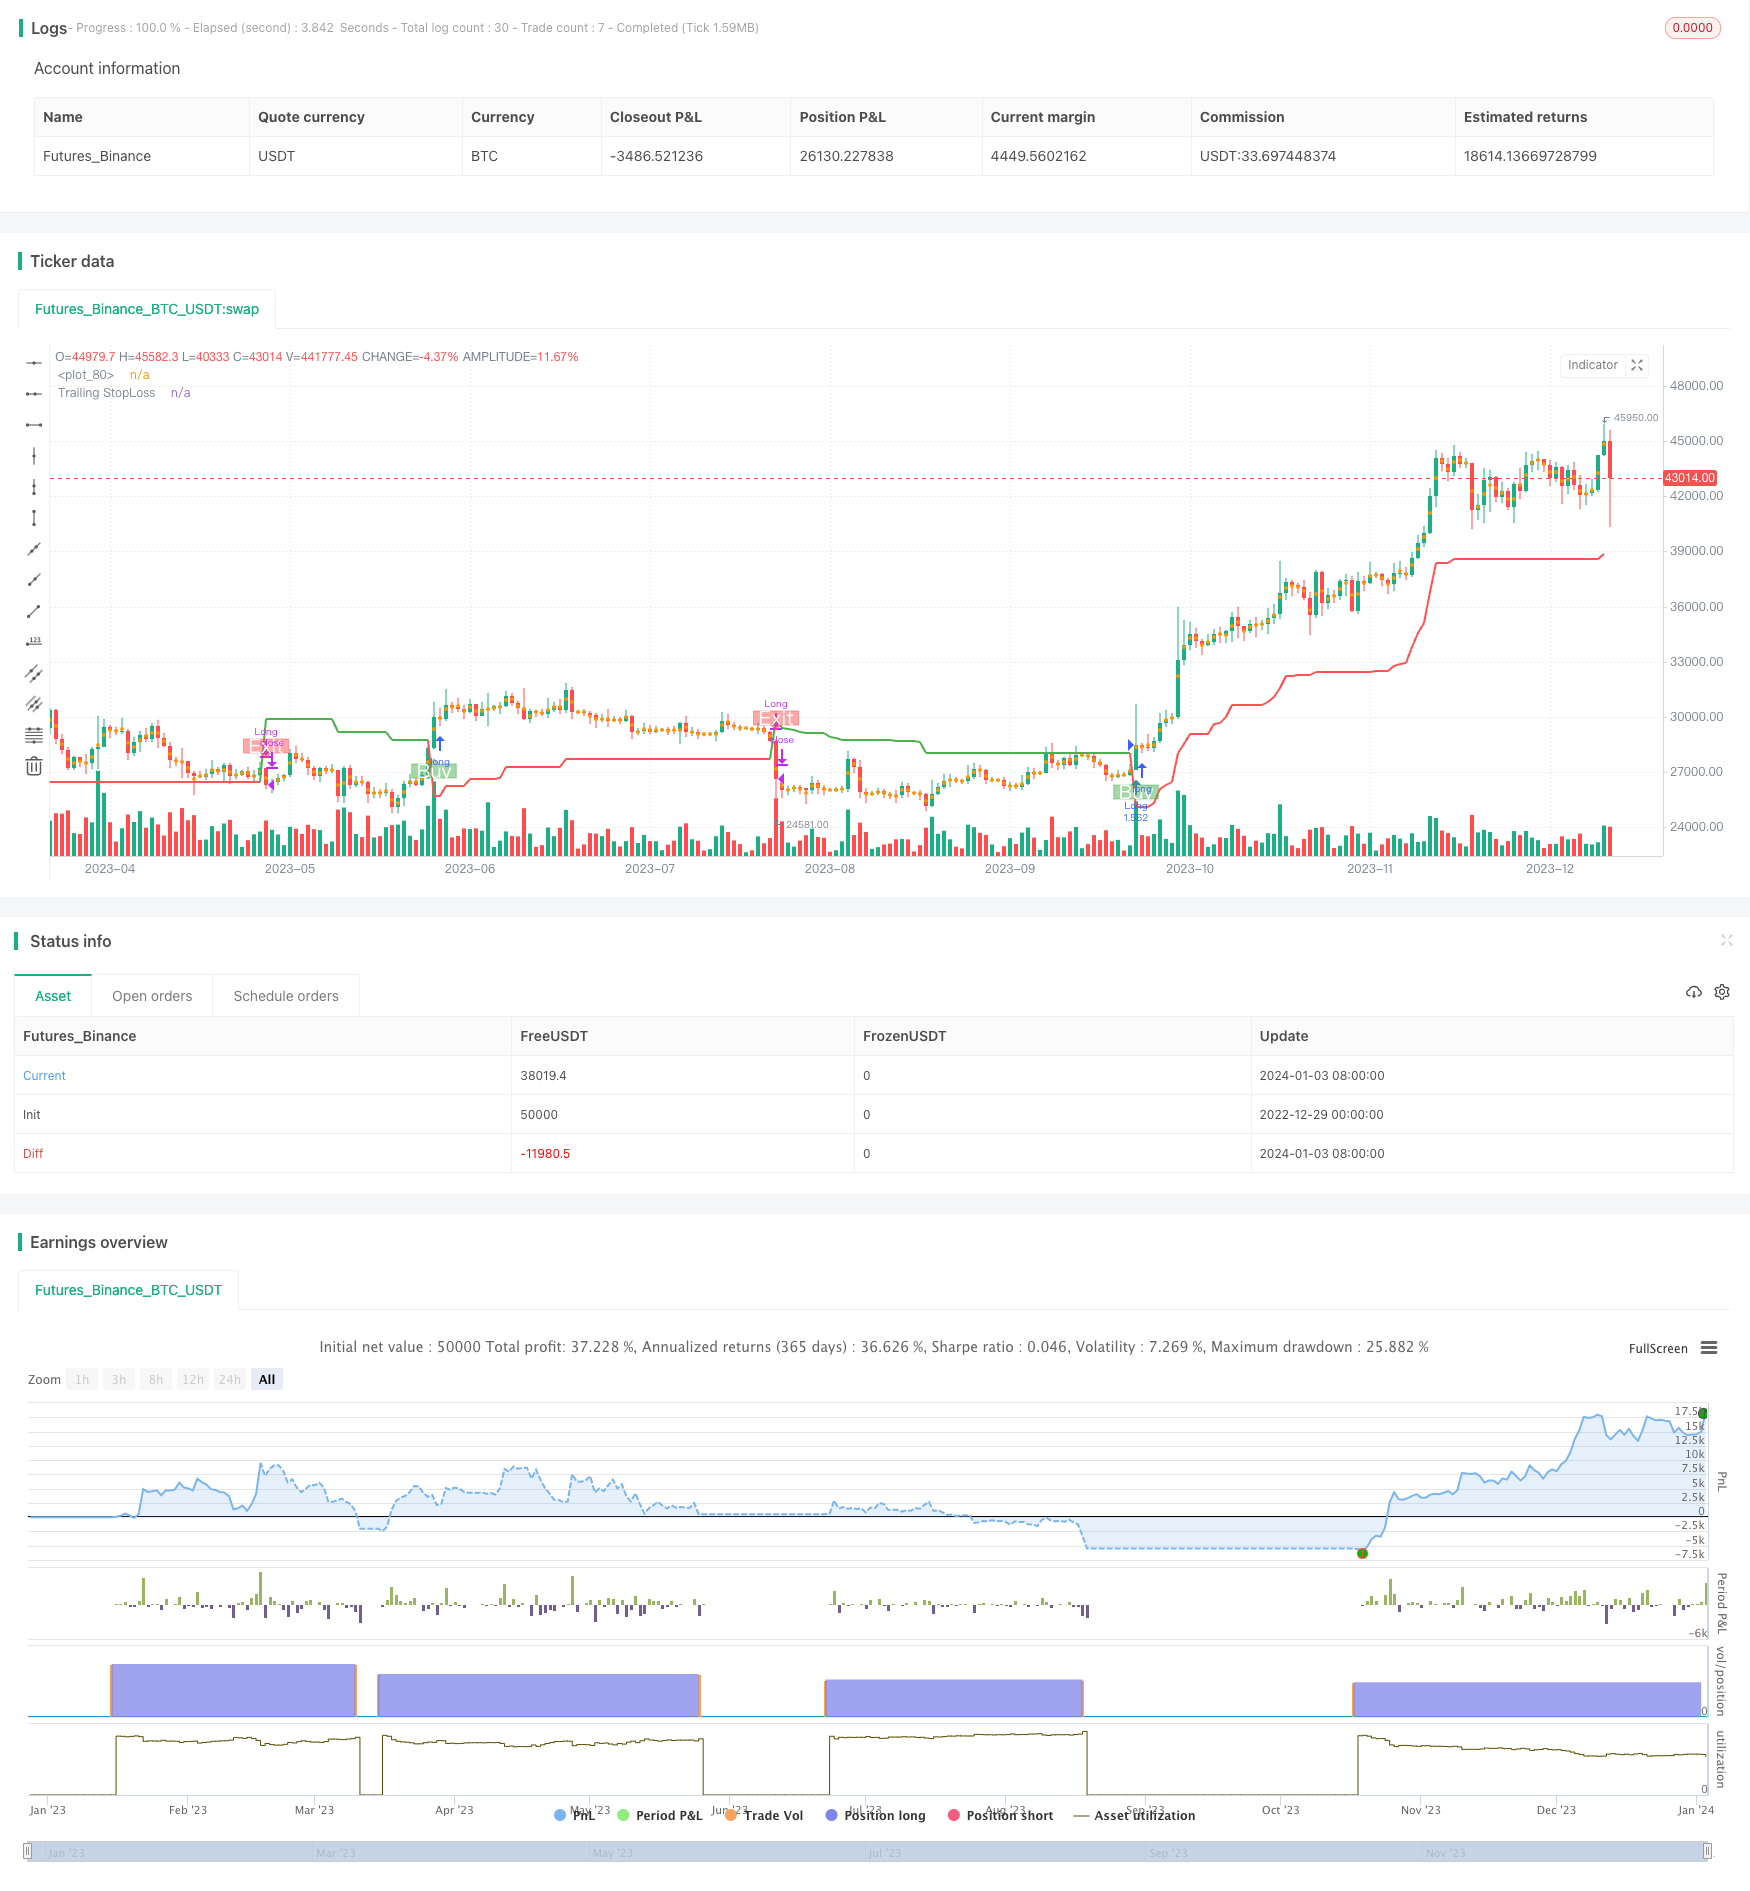
이 전략은 평균 실제 파장 (ATR) 을 기반으로 한 트렌드 추적 전략이다. ATR을 사용하여 지표 값을 계산하여 가격 트렌드 방향을 판단한다. 이 전략은 동시에 위험을 제어하기 위해 손실 장치를 제공합니다.
전략 원칙
이 전략은 세 가지 주요 변수를 사용한다: 주기 기간, 곱하기 멀티플라이어 및 입출점 입출점/출구 포인트. 기본 변수는 14개의 주기 ATR과 4배의 곱하기이다.
이 전략은 먼저 다목표 평균 가격 (buyavg) 과 공수수 평균 가격 (sellavg) 을 계산한 다음 가격과 이 두 개의 공수수 가격의 관계를 비교하여 현재 트렌드 방향을 판단한다. 가격이 공수수 평균 가격보다 높으면 다목표로 판단하고, 가격이 공수수 평균 가격보다 낮으면 공수로 판단한다.
또한, 이 전략은 ATR과 결합하여 트레일링 스톱 로스를 설정한다. 구체적인 방법은: ATR의 14주기 가중 이동 평균을 곱한 곱하기 (기본 4) 를 스톱 로스로 한다. 이렇게 시장의 변동 정도에 따라 스톱 로스를 조정할 수 있다.
이 전략은 스톱로스가 발생하면 수익을 평정합니다.
전략적 이점
- 트렌드 판단을 바탕으로 지속가능한 수익을 창출할 수 있습니다.
- ATR을 사용하여 동적으로 정지 거리를 조정하여 위험을 효과적으로 제어합니다.
- 구매 및 판매 지점을 계산하는 것은 간단하고 직관적이며 이해하기 쉬운 방법입니다.
위험과 대책
- 트렌드가 바뀌면 더 큰 손실이 발생할 수 있습니다.
- ATR 주기와 곱셈을 적절하게 조정하여 스톱 거리 최적화
- WILL은 여러 차례의 소액 손실을 기록했습니다.
- 필터링 조건을 높여 시장의 흔들림을 방지하라
- 잘못된 변수 설정으로 인해 정책 효과가 저하될 수 있습니다.
- 다중 조합 변수 최적화 테스트, 최적의 변수를 찾아
전략 최적화 방향
- 다른 지표로 필터링 신호를 판단하여 진동 시 출전 및 출전을 피합니다.
- ATR 주기와 곱셈 변수를 최적화하여 스톱디스플레이를 합리화합니다.
- 포지션 크기를 시장 상황에 따라 조정하는 포지션 제어
요약하다
이 전략은 전체적으로 간단하고 실용적인 트렌드 추적 전략이다. 그것은 단지 소수의 파라미터만 필요로 하고, ATR를 통해 동적으로 손해를 조정하여 위험을 효과적으로 제어할 수 있다. 다른 보조 판단 지표와 함께하면, 추가적으로 최적화하여 일부 잡음 신호를 필터링 할 수 있다.
전략 소스 코드
/*backtest
start: 2022-12-29 00:00:00
end: 2024-01-04 00:00:00
period: 1d
basePeriod: 1h
exchanges: [{"eid":"Futures_Binance","currency":"BTC_USDT"}]
*/

//@version=5
strategy('Trend Strategy by zdmre', shorttitle='Trend Strategy', overlay=true, pyramiding=0, currency=currency.USD, default_qty_type=strategy.percent_of_equity, initial_capital=10000, default_qty_value=100, commission_type=strategy.commission.percent, commission_value=0.005)
show_STOPLOSSprice = input(true, title='Show TrailingSTOP Prices')
src = input(close, title='Source')
out2 = ta.ema(src, 20)

buyavg = (close + high) / 2.02 - high * (1 - open / close) * (1 - low * open / (high * close))
sellavg = ((low + close) / 1.99 + low * (1 - low / open) * (1 - low * open / (close * high)) / 1.1 + out2 )/ 2

// === INPUT BACKTEST RANGE ===
fromMonth = input.int(defval=1, title='From Month', minval=1, maxval=12)
fromDay = input.int(defval=1, title='From Day', minval=1, maxval=31)
fromYear = input.int(defval=2021, title='From Year', minval=1970)
thruMonth = input.int(defval=1, title='Thru Month', minval=1, maxval=12)
thruDay = input.int(defval=1, title='Thru Day', minval=1, maxval=31)
thruYear = input.int(defval=2100, title='Thru Year', minval=1970)

// === INPUT SHOW PLOT ===
showDate = input(defval=true, title='Show Date Range')

// === FUNCTION EXAMPLE ===
start = timestamp(fromYear, fromMonth, fromDay, 00, 00)  // backtest start window
finish = timestamp(thruYear, thruMonth, thruDay, 23, 59)  // backtest finish window
window() => true


// === TRAILING STOP LOSS === //

ATR_Period = input(14)
ATR_Mult = input(4.0)
var float ATR_TrailSL = na
var int pos = na
atr = ta.rma (ta.tr(true), 14)
xATR = ta.atr(ATR_Period)
nLoss = ATR_Mult * xATR

iff_1 = close > nz(ATR_TrailSL[1], 0) ? close - nLoss : close + nLoss
iff_2 = close < nz(ATR_TrailSL[1], 0) and close[1] < nz(ATR_TrailSL[1], 0) ? math.min(nz(ATR_TrailSL[1]), close + nLoss) : iff_1
ATR_TrailSL := close > nz(ATR_TrailSL[1], 0) and close[1] > nz(ATR_TrailSL[1], 0) ? math.max(nz(ATR_TrailSL[1]), close - nLoss) : iff_2

iff_3 = close[1] > nz(ATR_TrailSL[1], 0) and close < nz(ATR_TrailSL[1], 0) ? -1 : nz(pos[1], 0)
pos := close[1] < nz(ATR_TrailSL[1], 0) and close > nz(ATR_TrailSL[1], 0) ? 1 : iff_3

atr_color = pos == -1 ? color.green : pos == 1 ? color.red : color.aqua
atrtrend = plot(ATR_TrailSL, 'Trailing StopLoss', atr_color, linewidth=2)

// ===  Stop Loss === //
slGroup = 'Stop Loss'
useSL = input.bool(false, title='╔══════   Enable   ══════╗', group=slGroup, tooltip='If you are using this strategy for Scalping or Futures market, we do not recommend using Stop Loss.')
SLbased = input.string(title='Based on', defval='Percent', options=['ATR', 'Percent'], group=slGroup, tooltip='ATR: Average True Range\nPercent: eg. 5%.')
multiATR = input.float(10.0, title='ATR   Mult', group=slGroup, inline='atr')
lengthATR = input.int(14, title='Length', group=slGroup, inline='atr')
SLPercent = input.float(5, title='Percent', group=slGroup) * 0.01
Shortposenter = input.bool(false, title='ShortPosition')

longStop = 0.0
shortStop = 0.0

if SLbased == 'ATR'
    longStop := ta.valuewhen(pos == 1, low, 0) - ta.valuewhen(pos == 1, ta.rma(ta.tr(true), lengthATR), 0) * multiATR
    longStopPrev = nz(longStop[1], longStop)
    longStop := close[1] > longStopPrev ? math.max(longStop, longStopPrev) : longStop

    shortStop := ta.valuewhen(pos == -1, ta.rma(ta.tr(true), lengthATR), 0) * multiATR + ta.valuewhen(pos == -1, high, 0)
    shortStopPrev = nz(shortStop[1], shortStop)
    shortStop := close[1] > shortStopPrev ? math.max(shortStop, shortStopPrev) : shortStop
    shortStop
if SLbased == 'Percent'
    longStop := strategy.position_avg_price * (1 - SLPercent)
    shortStop := strategy.position_avg_price * (1 + SLPercent)
    shortStop
exitLong  = pos == -1

// === PlotColor === //
buySignal = pos == 1 and pos[1] == -1
plotshape(buySignal, title="Long", location=location.belowbar, style=shape.labelup, size=size.normal, color=color.new(color.green,50), text='Buy', textcolor=color.white)
exitSignal = pos == -1 and pos[1] == 1
plotshape(exitSignal, title="Exit", location=location.abovebar, style=shape.labeldown, size=size.normal, color=color.new(color.red,50), text='Exit', textcolor=color.white)

hPlot = plot(ohlc4, title="", style=plot.style_circles, linewidth=0, editable = false)
longFill = (pos == 1 ? color.new(color.green,80) : na)
shortFill = (pos == -1 ? color.new(color.red,80) : na)
fill(hPlot, atrtrend,color=longFill)
fill(hPlot,atrtrend, color=shortFill)

// === Strategy === //
strategy.entry('Long', strategy.long,limit = buyavg, when=window() and pos == 1,comment="Entry: "+str.tostring(buyavg))
strategy.close('Long', when=window() and exitLong , comment='Exit: '+str.tostring(sellavg) )

if Shortposenter
    strategy.entry('Short', strategy.short, when=window() and pos== -1,comment="Entry: "+str.tostring(close))
    strategy.close('Short', when=window() and pos == 1 , comment='Exit: ')

if useSL
    strategy.exit('Stop Loss', 'Long', stop=longStop)

// === Show StopLoss Price === //
if show_STOPLOSSprice
    if pos == -1
        label ShortStop = label.new(bar_index, na, 'SL: ' + str.tostring(ATR_TrailSL), color=color.green, textcolor=color.white, style=label.style_none, yloc=yloc.abovebar, size=size.small)
        label.delete(ShortStop[1])

    if pos == 1
        label LongStop = label.new(bar_index, na, 'SL: ' + str.tostring(ATR_TrailSL), color=color.red, textcolor=color.white, style=label.style_none, yloc=yloc.belowbar, size=size.small)
        label.delete(LongStop[1])