개요
EintSimple Pullback Strategy는 두 개의 이동 평균의 교차에 기반한 역전입 전략이다. 이 전략은 먼저 장기 및 단기 이동 평균을 사용하여, 단기 이동 평균이 아래에서 장기 이동 평균을 돌파할 때 구매 신호를 생성한다. 휴일 돌파를 필터링하기 위해, 이 전략은 또한 장기 이동 평균보다 높은 종결 가격을 요구한다.
진입 후, 가격이 단기 이동 평균을 다시 넘어간다면, btc는 퇴출 신호를 나타냅니다. 또한, 이 전략은 퇴출 손실을 설정하고, 최고 지점에서 철회 폭이 설정된 중지 손실 퍼센트에 도달하면 퇴출됩니다.
전략의 원리 Strategy Logic
이 전략은 주로 두 개의 이동 평균의 골드 크로스 (Golden Cross) 를 기반으로 진입 시점을 판단한다. 구체적으로, 다음과 같은 조건이 동시에 충족되어야 더 많은 포지션을 열 수 있다:
- 종점 가격은 장기 이동 평균 ma1보다 크다.
- 종점 가격은 단기 이동 평균 mA2보다 낮습니다.
- 현재 지분 없음
위 조건이 충족되면, 이 전략은 완전히 실행됩니다.
탈퇴 신호 판단은 두 가지 조건에 기초하고 있는데, 하나는 가격이 다시 단기 이동 평균을 넘어가는 것이고, 다른 하나는 최고점 회수폭에서 설정된 스톱 로즈 비율이다. 구체적인 탈퇴 조건은 다음과 같다:
- 종점 가격은 단기 이동 평균 ma2보다 크다.
- 최대점 회수폭에서 설정된 스톱 손실의 %
이 전략은 어떤 탈퇴 조건이 충족될 때 모든 추가 항목을 평행합니다.
장점 분석 Advantages
이중 이동 평균을 교차하고 실물 종결 가격 판단과 결합하면 가짜 돌파구를 효과적으로 필터링 할 수 있습니다.
재조정 입장은 주가가 단기 전환점 (short-term turning point) 을 형성한 후에 입수할 수 있다.
최대 인출을 제한할 수 있는 Stop Loss 설정이 있습니다.
위험 분석
이중 이동 평균 교차 전략은 여러 거래 신호를 생성할 수 있으며, 상승과 하락을 추적할 수 있다.
이동 평균 파라미터를 잘못 설정하면 곡선이 너무 부드럽거나 너무 민감해질 수 있다.
하지만, 이 경우에도, 손실이 커질 수 있습니다.
최적화 방향 Optimization
다양한 길이의 장기 단기 이동 평균 변수 조합을 테스트하여 최적의 변수를 찾습니다.
클로즈 가격과 전형적인 가격을 사용하여 이동 평균의 교차를 판단하는 효과를 비교 테스트한다.
거래량이나 변동성 지표와 같은 필터를 추가하여 테스트하십시오.
스톱 손실을 재검토하고 최적화하여 최적의 설정을 찾습니다.
결론 Conclusion
EintSimple Pullback Strategy는 간단하고 실용적인 이중 이동 평균 회귀 전략이다. 그것은 이동 평균의 지시 기능을 효과적으로 활용하면서 실물 종결 가격 판단과 결합하여 가짜 신호를 필터링한다. 이 전략은 빈번한 거래와 상하를 추격하는 문제를 일으키는 편이지만, 파라미터를 최적화하고 필터를 추가함으로써 더욱 개선될 수 있다.
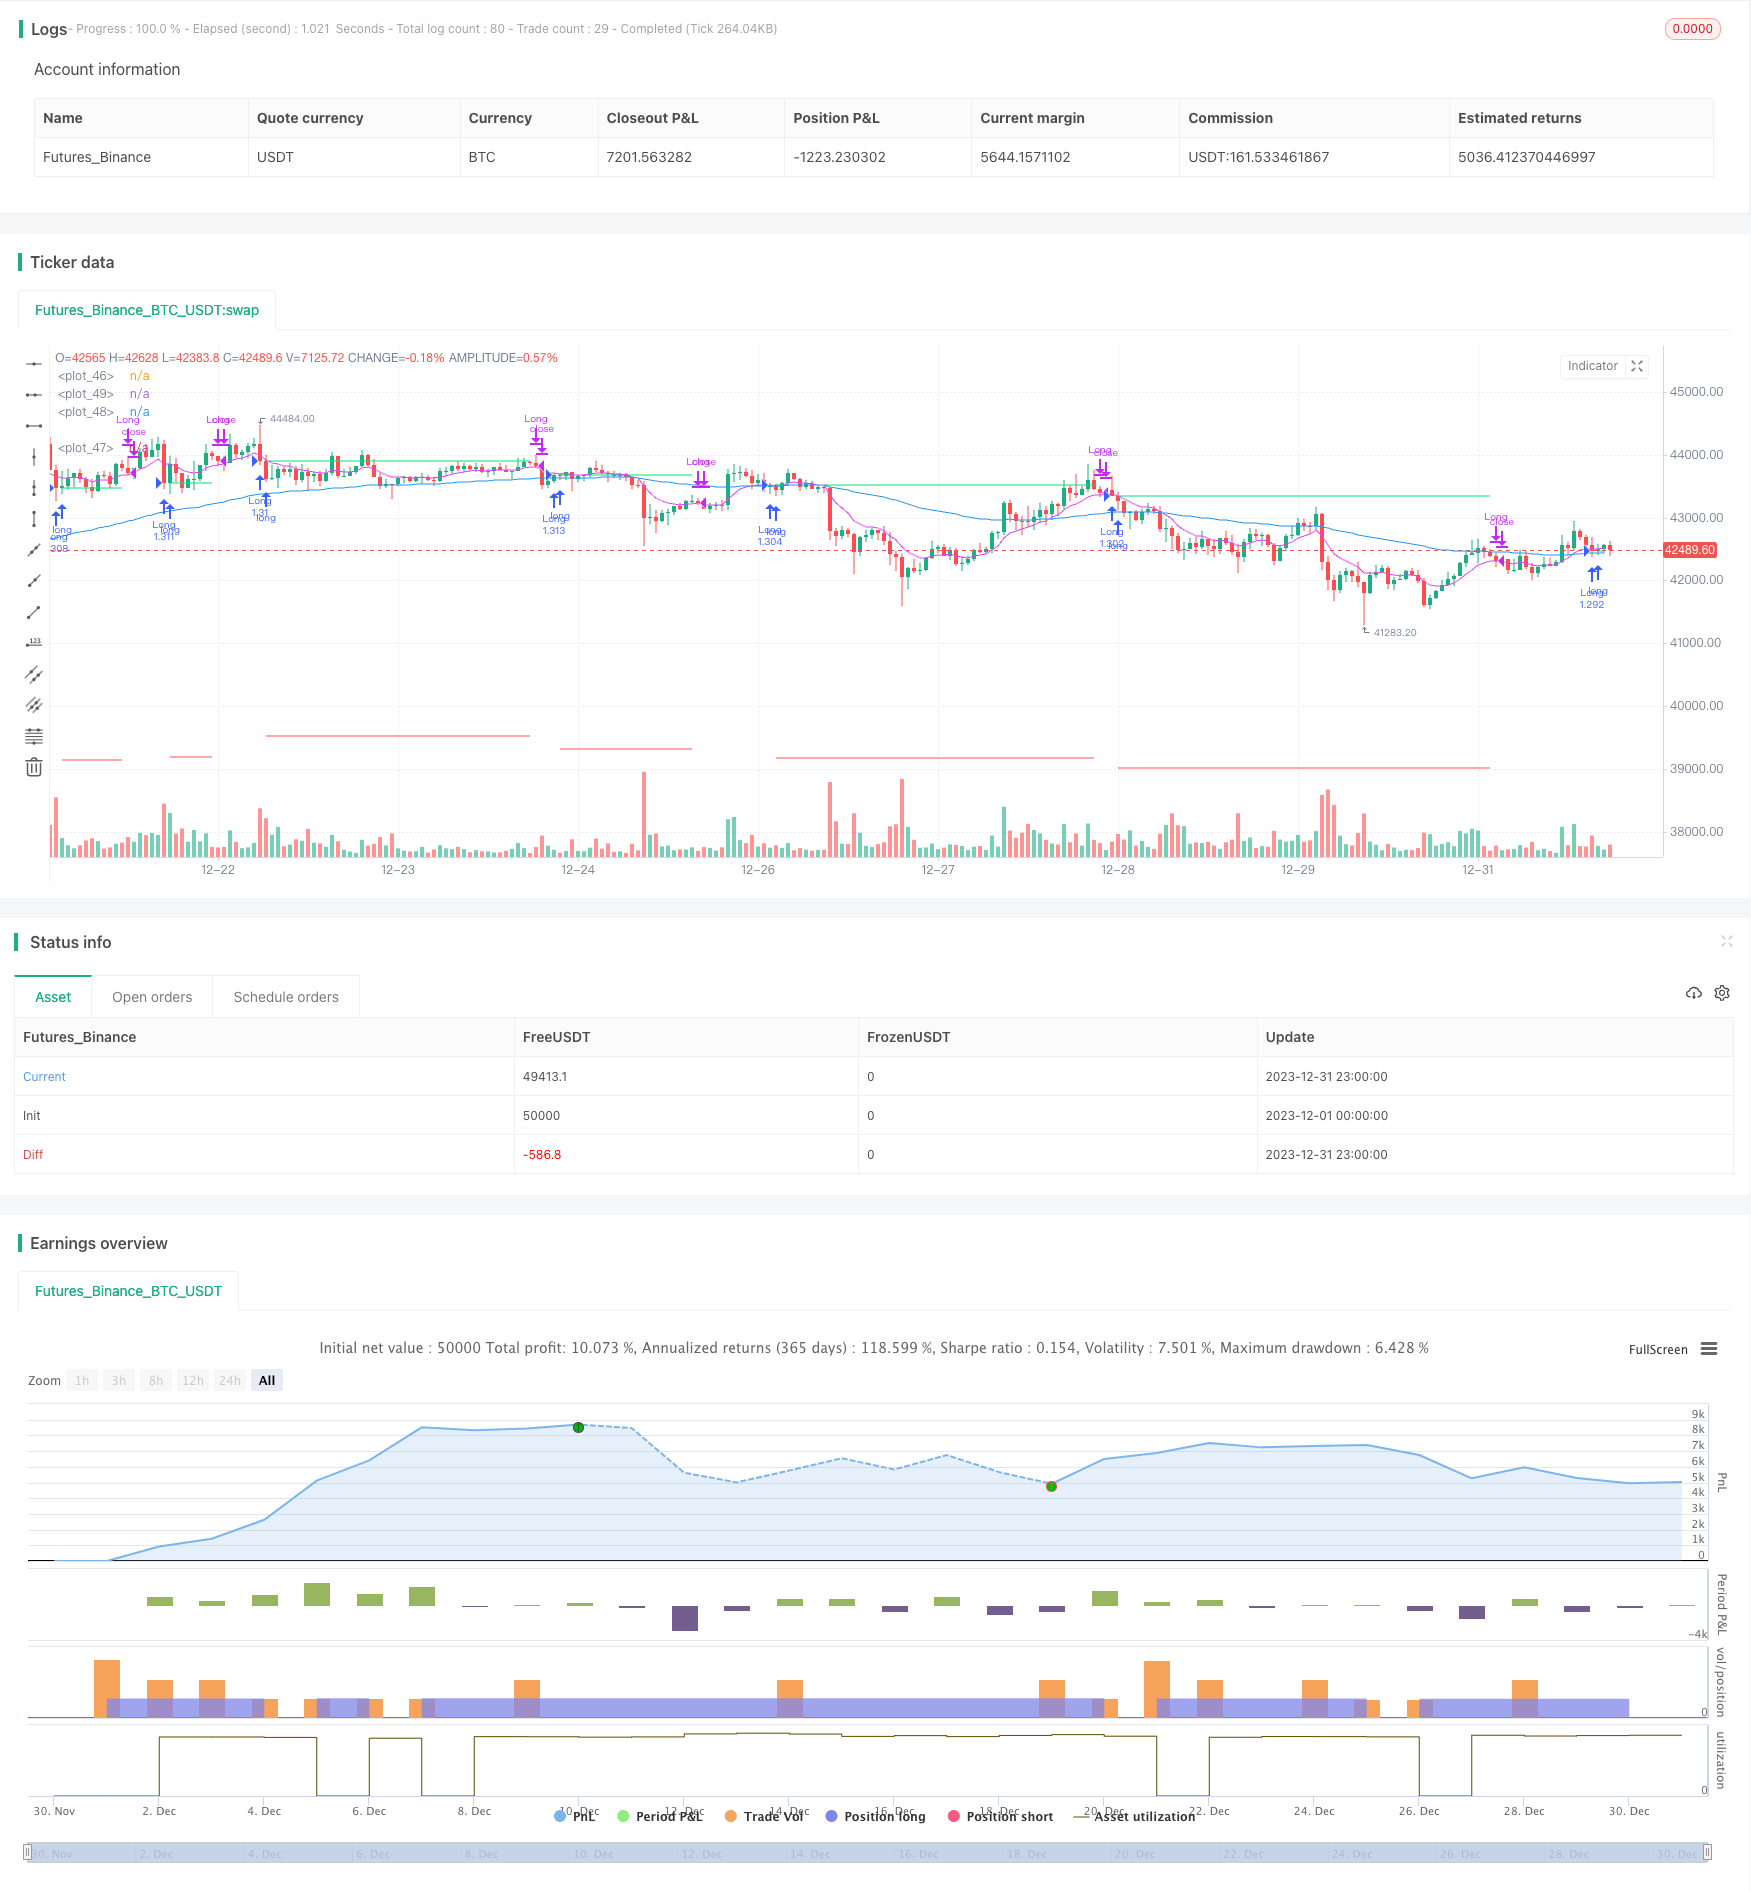
/*backtest
start: 2023-12-01 00:00:00
end: 2023-12-31 23:59:59
period: 1h
basePeriod: 15m
exchanges: [{"eid":"Futures_Binance","currency":"BTC_USDT"}]
*/

// This source code is subject to the terms of the Mozilla Public License 2.0 at https://mozilla.org/MPL/2.0/
// © ZenAndTheArtOfTrading / www.PineScriptMastery.com
// @version=5
strategy("Simple Pullback Strategy",
     overlay=true,
     initial_capital=50000,
     default_qty_type=strategy.percent_of_equity,
     default_qty_value=100)// 100% of balance invested on each trade

// Get user input
i_ma1           = input.int(title="MA 1 Length", defval=75, step=1, group="Strategy Parameters", tooltip="Long-term EMA")
i_ma2           = input.int(title="MA 2 Length", defval=9, step=1, group="Strategy Parameters", tooltip="Short-term EMA")
i_stopPercent   = input.float(title="Stop Loss Percent", defval=0.10, step=0.1, group="Strategy Parameters", tooltip="Failsafe Stop Loss Percent Decline")
i_lowerClose    = input.bool(title="Exit On Lower Close", defval=true, group="Strategy Parameters", tooltip="Wait for a lower-close before exiting above MA2")
i_startTime     = input(title="Start Filter", defval=timestamp("01 Jan 1995 13:30 +0000"), group="Time Filter", tooltip="Start date & time to begin searching for setups")
i_endTime       = input(title="End Filter", defval=timestamp("1 Jan 2099 19:30 +0000"), group="Time Filter", tooltip="End date & time to stop searching for setups")

// Get indicator values
ma1 = ta.ema(close, i_ma1)
ma2 = ta.ema(close, i_ma2)

// Check filter(s)
f_dateFilter = true

// Check buy/sell conditions
var float buyPrice = 0
buyCondition    = close > ma1 and close < ma2 and strategy.position_size == 0 and f_dateFilter
sellCondition   = close > ma2 and strategy.position_size > 0 and (not i_lowerClose or close < low[1])
stopDistance    = strategy.position_size > 0 ? ((buyPrice - close) / close) : na
stopPrice       = strategy.position_size > 0 ? buyPrice - (buyPrice * i_stopPercent) : na
stopCondition   = strategy.position_size > 0 and stopDistance > i_stopPercent

// Enter positions
if buyCondition
    strategy.entry(id="Long", direction=strategy.long)

if buyCondition[1]
    buyPrice := open

// Exit positions
if sellCondition or stopCondition
    strategy.close(id="Long", comment="Exit" + (stopCondition ? "SL=true" : ""))
    buyPrice := na

// Draw pretty colors
plot(buyPrice, color=color.lime, style=plot.style_linebr)
plot(stopPrice, color=color.red, style=plot.style_linebr, offset=-1)
plot(ma1, color=color.blue)
plot(ma2, color=color.fuchsia)