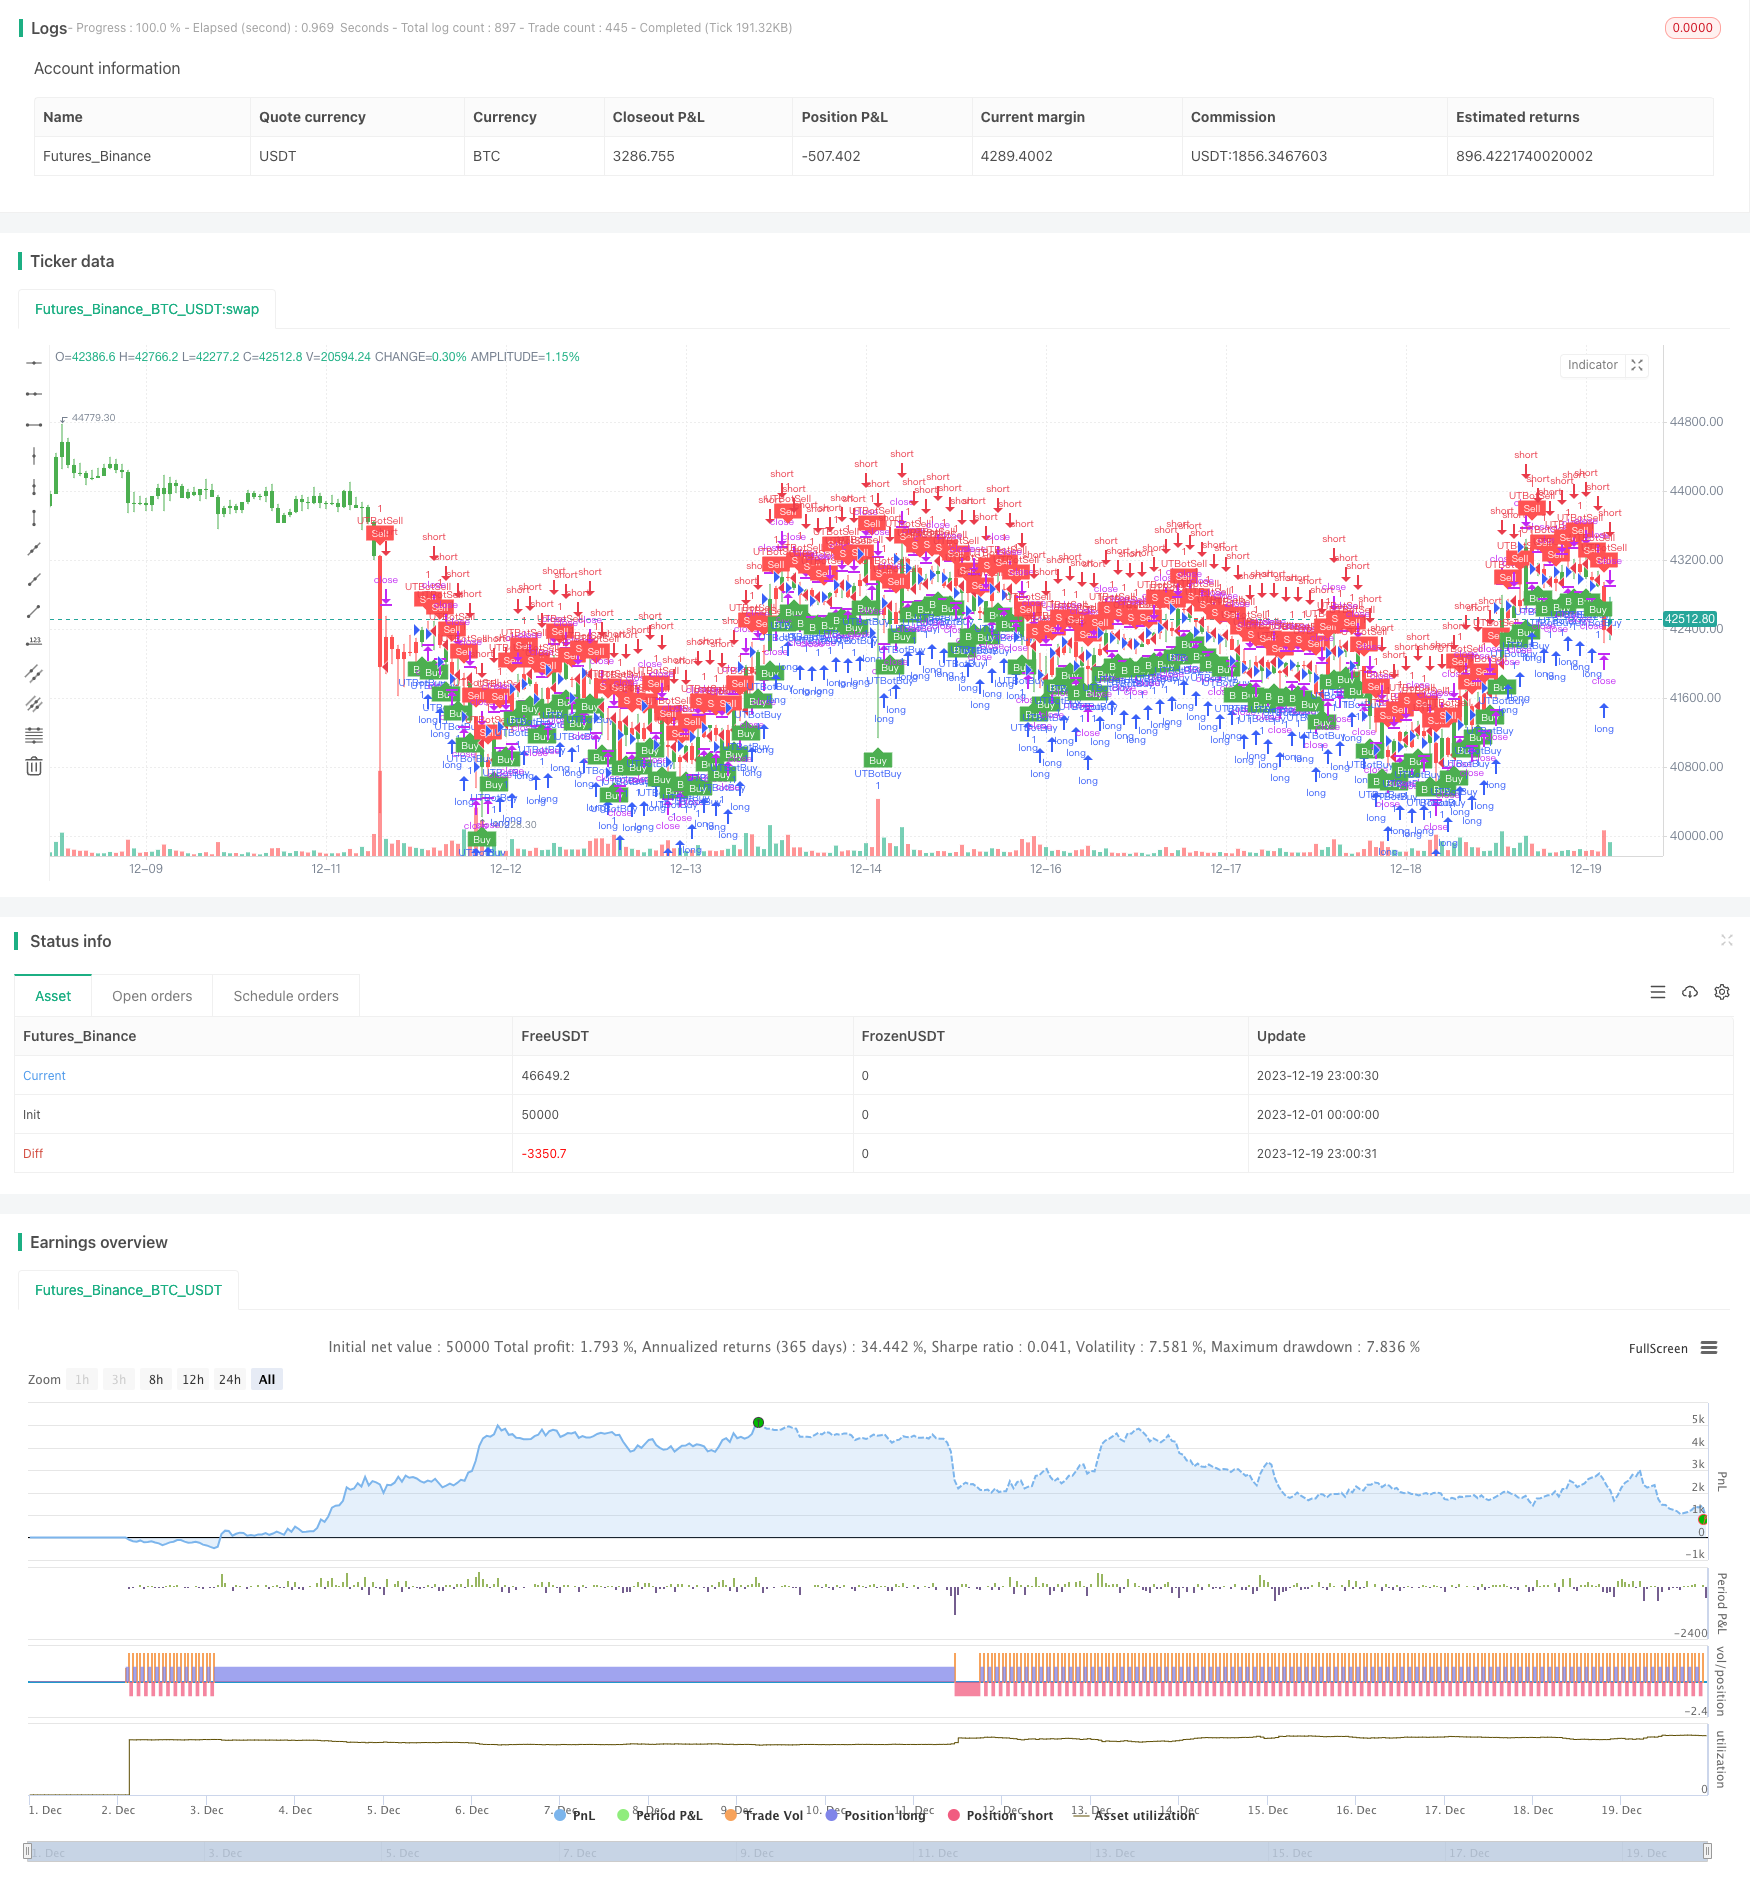
개요
이 전략은 평균 실제 변동 범위 ((ATR), 상대적으로 강한 지수 ((RSI) 와 모바일 스톱을 사용하여 적응하는 트렌드 추적을 수행합니다. ATR을 통해 동적 스톱 지점을 계산하고, RSI를 사용하여 시장의 추세를 판단하고, 모바일 스톱을 사용하여 가격 변동으로 수익을 극대화합니다.
전략 원칙
ATR을 계산한다. ATR은 시장의 변동성과 위험 수준을 반영한다. 이 전략은 ATR을 통해 동적 스톱 로즈를 계산하여 적응 스톱 로스를 실현한다.
RSI를 계산한다. RSI는 시장의 과매매 현상을 판단할 수 있다. RSI가 50보다 크면 호불호가 있고, 50보다 작으면 하락이다. 이 전략은 RSI를 사용하여 가격 경향 방향을 판단한다.
모바일 스톱 트래킹. 이 전략은 ATR 계산된 스톱 스텝과 RSI 판단에 따른 트렌드 방향에 따라 모바일 스톱을 실현하기 위해 가격 변동을 지속적으로 추적하고, 스톱 스텝을 점차적으로 확대하여 이익을 극대화합니다.
구체적으로, RSI가 50보다 크면 상위 포지션을 열고, 50보다 적은 포지션을 열었다. 그 후 ATR 계산을 이용한 중지 가격으로 이동 중지, 가격 변동을 추적한다.
우위 분석
ATR을 이용해서 자율적 제휴를 할 수 있고, 시장의 변동적 동력에 따라 제휴의 폭을 조정할 수 있으며, 제휴가 너무 크고 너무 작다는 단점을 피할 수 있다.
RSI는 트렌드 방향을 정확하게 판단하여 거래가 흔들리는 시장에 갇히지 않도록합니다.
모바일 스톱은 가격 변동을 추적하고, 스톱을 확대하여 트렌드를 충분히 추적할 수 있다.
위험 분석
ATR 및 RSI 파라미터 설정은 재검토를 통해 최적화되어야 하며, 그렇지 않으면 전략 효과에 영향을 미칩니다.
스톱로즈 보호는 있지만, 큰 폭의 폭파는 스톱로즈가 뚫릴 위험을 피할 수 없습니다. 위험을 통제하기 위해 포지션을 적절히 축소 할 수 있습니다.
전략은 거래 품종 파라미터를 최적화하는 데 의존성이 높으며, 다른 품종에 대한 파라미터를 조정해야 한다.
최적화 방향
기계 학습 알고리즘을 포함하여 파라미터의 자기 적응 최적화를 고려할 수 있다.
포지션 제어 모듈을 추가하여 시장 상황에 따라 포지션 크기를 동적으로 조정하여 상쇄 손실의 확률을 줄일 수 있습니다.
트렌드 판단 지표를 늘리고, 하위 역점을 놓친 손실을 방지한다.
요약하다
이 전략은 ATR, RSI 및 모바일 스톱과 같은 모듈을 통합하여 전형적인 자기 적응 트렌드 추적 전략을 형성합니다. 파라미터 최적화를 통해 다른 거래 품종에 매우 유연하게 적응 할 수 있으며, 권장되는 일반적인 트렌드 추적 전략입니다. 더 많은 지표 판단과 기계 학습 알고리즘 최적화를 추가하면 이 전략의 효과가 더욱 향상 될 수 있습니다.
/*backtest
start: 2023-12-01 00:00:00
end: 2023-12-19 23:59:59
period: 1h
basePeriod: 15m
exchanges: [{"eid":"Futures_Binance","currency":"BTC_USDT"}]
*/

//@version=2
strategy(title="UTBot Strategy", overlay = true )

// CREDITS to @HPotter for the orginal code.
// CREDITS to @Yo_adriiiiaan for recently publishing the UT Bot study based on the original code -
// CREDITS to @TradersAITradingPlans for making this Strategy.
// Strategy fixed with Time period by Kirk65.
// I am using this UT bot with 2 hours time frame with god resultss. Alert with "Once per bar" and stoploss 1.5%. If Alerts triggered and price goes against Alert. Stoploss will catch it. Wait until next Alert.
// While @Yo_adriiiiaan mentions it works best on a 4-hour timeframe or above, witch is a lot less risky, but less profitable.

testStartYear = input(2019, "BACKTEST START YEAR", minval = 1980, maxval = 2222)
testStartMonth = input(01, "BACKTEST START MONTH", minval = 1, maxval = 12)
testStartDay = input(01, "BACKTEST START DAY", minval = 1, maxval = 31)
testPeriodStart = timestamp(testStartYear,testStartMonth,testStartDay,0,0)
testStopYear = input(2222, "BACKTEST STOP YEAR", minval=1980, maxval = 2222)
testStopMonth = input(12, "BACKTEST STOP MONTH", minval=1, maxval=12)
testStopDay = input(31, "BACKTEST STOP DAY", minval=1, maxval=31)
testPeriodStop = timestamp(testStopYear, testStopMonth, testStopDay, 0, 0)

testPeriod = true

SOURCE = input(hlc3)
RSILENGTH = input(14, title = "RSI LENGTH")
RSICENTERLINE = input(52, title = "RSI CENTER LINE")
MACDFASTLENGTH = input(7, title = "MACD FAST LENGTH")
MACDSLOWLENGTH = input(12, title = "MACD SLOW LENGTH")
MACDSIGNALSMOOTHING = input(12, title = "MACD SIGNAL SMOOTHING")
a = input(10, title = "Key Vaule. 'This changes the sensitivity'")
SmoothK = input(3)
SmoothD = input(3)
LengthRSI = input(14)
LengthStoch = input(14)
RSISource = input(close)
c = input(10, title="ATR Period")
xATR = atr(c)
nLoss = a * xATR
xATRTrailingStop = iff(close > nz(xATRTrailingStop[1], 0) and close[1] > nz(xATRTrailingStop[1], 0), max(nz(xATRTrailingStop[1]), close - nLoss),
     iff(close < nz(xATRTrailingStop[1], 0) and close[1] < nz(xATRTrailingStop[1], 0), min(nz(xATRTrailingStop[1]), close + nLoss),
     iff(close > nz(xATRTrailingStop[1], 0), close - nLoss, close + nLoss)))
pos =	iff(close[1] < nz(xATRTrailingStop[1], 0) and close > nz(xATRTrailingStop[1], 0), 1,
     iff(close[1] > nz(xATRTrailingStop[1], 0) and close < nz(xATRTrailingStop[1], 0), -1, nz(pos[1], 0)))
color = pos == -1 ? red: pos == 1 ? green : blue
ema= ema(close,1)
above = crossover(ema,xATRTrailingStop )
below = crossover(xATRTrailingStop,ema)
buy = close > xATRTrailingStop and above
sell = close < xATRTrailingStop and below
barbuy = close > xATRTrailingStop
barsell = close < xATRTrailingStop
plotshape(buy, title = "Buy", text = 'Buy', style = shape.labelup, location = location.belowbar, color= green,textcolor = white, transp = 0, size = size.tiny)
plotshape(sell, title = "Sell", text = 'Sell', style = shape.labeldown, location = location.abovebar, color= red,textcolor = white, transp = 0, size = size.tiny)
barcolor(barbuy? green:na)
barcolor(barsell? red:na)
//alertcondition(buy, title='Buy', message='Buy')
//alertcondition(sell, title='Sell', message='Sell')

if (buy)
    strategy.entry("UTBotBuy",strategy.long, when=testPeriod)
if (sell)
    strategy.entry("UTBotSell",strategy.short, when=testPeriod)