개요
이 전략은 다양한 주기의 EMA 평균선을 계산하여 현재 시장이 어떤 주기적 단계에 있는지 판단하고 ATR과 결합하여 돌파구를 판단하여 높은 확률의 트렌드 추적 거래를 달성한다.
전략 원칙
- 5일선, 20일선, 40일선 3개의 EMA 평균선
- 3개의 평균선을 비교하여 현재 6개의 다른 주기적 단계 중 하나에 있는 것을 판별합니다.
- 5일선>20일선>40일선 1주기
- 20일선>5일선>40일선 2주기 ……
- 주기를 확인한 후 ATR 지수를 계산하고 ATR 배수를 돌파 기준으로 설정합니다.
- ATR 트레일링 스톱의 마지막 BAR를 넘으면 구매 신호가 발생한다.
- ATR 트레일링 스톱의 마지막 BAR를 넘으면 판매 신호가 발생합니다.
- 이러한 조합을 통해 높은 확률의 트렌드 추적 거래를 달성합니다.
전략적 이점
- 주기적 판단은 신호의 신뢰성을 증가시킨다.
다른 EMA 평균선의 크기의 관계를 판단함으로써, 시장이 현재 어떤 주기적 단계에 있는지 효과적으로 판단할 수 있으며, 부적절한 주기에서 잘못된 신호를 피할 수 있다.
- ATR 해커가 가짜 신호를 필터링했다
ATR 지표는 시장의 변동성을 효과적으로 표현할 수 있으며, 특정 배수의 ATR을 돌파 기준으로 설정하여 많은 가짜 돌파 신호를 필터링 할 수 있습니다.
- 포트폴리오 판단은 높은 확률의 거래 기회를 만듭니다.
주기 판단과 ATR 돌파 판단의 유기적 결합은 신호를 생성할 확률을 크게 높여주고, 따라서 거래의 수익률을 높여준다.
전략적 위험
- 매개 변수 최적화 난이도가 높다
정책은 여러 개의 변수를 포함하고 있기 때문에 최적화하기가 더 어렵습니다. 잘못된 변수 설정은 정책의 성능에 영향을 미칠 수 있습니다.
- 그리고 그 결과,
시장이 급격하게 변할 때, EMA 평균선과 ATR 지표는 모두 약간의 지연이 있으며, 잘못된 신호를 생성하거나 기회를 놓칠 수 있습니다.
- 엄격한 제약이 필요합니다.
어떤 기술 지표도 잘못된 신호를 완전히 방지하기 어렵고, 위험을 통제하기 위해 엄격한 스톱 손실을 설정해야 한다.
전략 최적화 방향
- 추가 최적화 매개 변수
더 풍부한 역사 데이터를 통해 파라미터를 최적화하여 최적의 파라미터 조합을 찾습니다.
- 적응력을 높여라
시장의 변동성에 따라 자동으로 ATR 변수를 조정하여 전략의 적응력을 높이는 것을 고려할 수 있습니다.
- 다른 지표와 함께
진동률, 교차량 등 다른 지표와 결합하여 판단을 보조하여 신호 품질을 향상시킬 수 있다.
요약하다
이 전략은 EMA 평균선 판단 주기 및 ATR 지표를 통해 동력 돌파 기준을 설정하여 높은 확률의 트렌드 추적 거래를 달성한다. 판단 주기, 필터 가짜 신호, 신호 품질 향상 등의 장점이 있다. 그러나 또한 매개 변수를 최적화하는 데 어려움이 많고, 지연이 존재하는 등의 위험도 있다. 추가로 매개 변수를 최적화하고, 적응력을 높이는 등의 전략 개선이 필요하다.
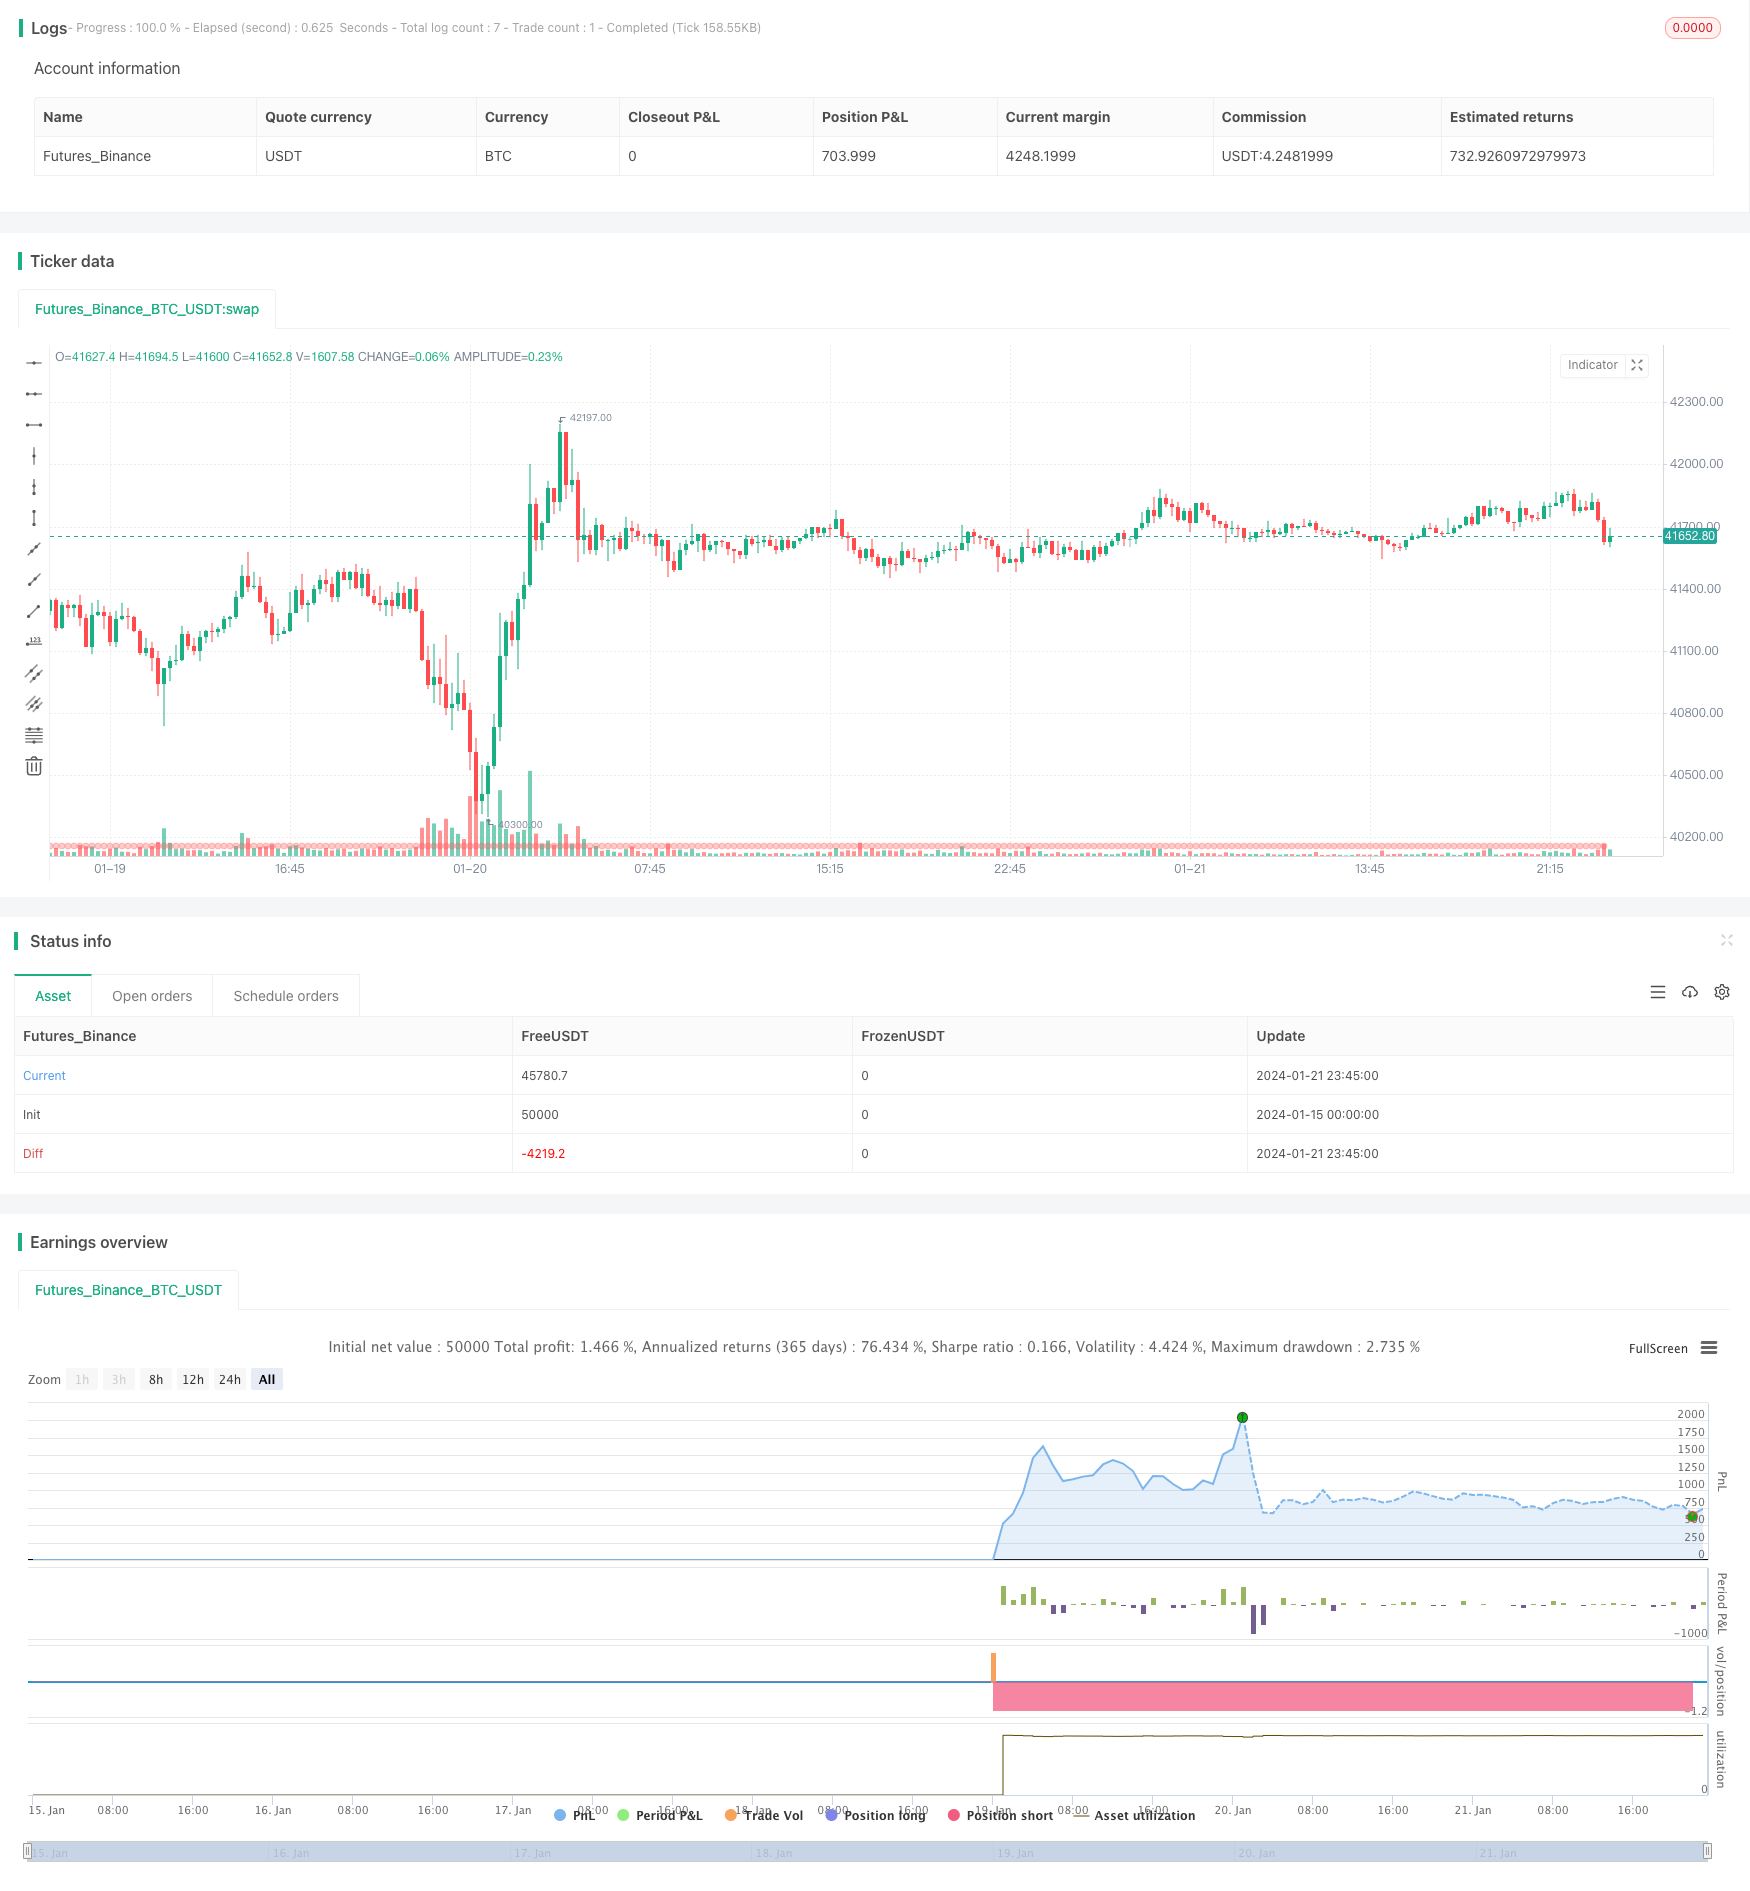
/*backtest
start: 2024-01-15 00:00:00
end: 2024-01-22 00:00:00
period: 15m
basePeriod: 5m
exchanges: [{"eid":"Futures_Binance","currency":"BTC_USDT"}]
*/

// This source code is subject to the terms of the Mozilla Public License 2.0 at https://mozilla.org/MPL/2.0/
// © kgynofomo

//@version=5
strategy(title="[Salavi] | Andy Advance Pro Strategy",overlay = true)

ema_short = ta.ema(close,5)
ema_middle = ta.ema(close,20)
ema_long = ta.ema(close,40)

cycle_1 = ema_short>ema_middle and ema_middle>ema_long
cycle_2 = ema_middle>ema_short and ema_short>ema_long
cycle_3 = ema_middle>ema_long and ema_long>ema_short
cycle_4 = ema_long>ema_middle and ema_middle>ema_short
cycle_5 = ema_long>ema_short and ema_short>ema_middle
cycle_6 = ema_short>ema_long and ema_long>ema_middle

bull_cycle = cycle_1 or cycle_2 or cycle_3
bear_cycle = cycle_4 or cycle_5 or cycle_6
// label.new("cycle_1")
// bgcolor(color=cycle_1?color.rgb(82, 255, 148, 60):na)
// bgcolor(color=cycle_2?color.rgb(82, 255, 148, 70):na)
// bgcolor(color=cycle_3?color.rgb(82, 255, 148, 80):na)
// bgcolor(color=cycle_4?color.rgb(255, 82, 82, 80):na)
// bgcolor(color=cycle_5?color.rgb(255, 82, 82, 70):na)
// bgcolor(color=cycle_6?color.rgb(255, 82, 82, 60):na)

// Inputs
a = input(2, title='Key Vaule. \'This changes the sensitivity\'')
c = input(7, title='ATR Period')
h = false

xATR = ta.atr(c)
nLoss = a * xATR

src = h ? request.security(ticker.heikinashi(syminfo.tickerid), timeframe.period, close, lookahead=barmerge.lookahead_off) : close

xATRTrailingStop = 0.0
iff_1 = src > nz(xATRTrailingStop[1], 0) ? src - nLoss : src + nLoss
iff_2 = src < nz(xATRTrailingStop[1], 0) and src[1] < nz(xATRTrailingStop[1], 0) ? math.min(nz(xATRTrailingStop[1]), src + nLoss) : iff_1
xATRTrailingStop := src > nz(xATRTrailingStop[1], 0) and src[1] > nz(xATRTrailingStop[1], 0) ? math.max(nz(xATRTrailingStop[1]), src - nLoss) : iff_2

pos = 0
iff_3 = src[1] > nz(xATRTrailingStop[1], 0) and src < nz(xATRTrailingStop[1], 0) ? -1 : nz(pos[1], 0)
pos := src[1] < nz(xATRTrailingStop[1], 0) and src > nz(xATRTrailingStop[1], 0) ? 1 : iff_3

xcolor = pos == -1 ? color.red : pos == 1 ? color.green : color.blue

ema = ta.ema(src, 1)
above = ta.crossover(ema, xATRTrailingStop)
below = ta.crossover(xATRTrailingStop, ema)

buy = src > xATRTrailingStop and above
sell = src < xATRTrailingStop and below

barbuy = src > xATRTrailingStop
barsell = src < xATRTrailingStop


atr = ta.atr(14)
atr_length = input.int(25)
atr_rsi = ta.rsi(atr,atr_length)
atr_valid = atr_rsi>50

long_condition =  buy and bull_cycle and atr_valid
short_condition =  sell and bear_cycle and atr_valid

Exit_long_condition = short_condition
Exit_short_condition = long_condition

if long_condition
    strategy.entry("Andy Buy",strategy.long, limit=close,comment="Andy Buy Here")

if Exit_long_condition
    strategy.close("Andy Buy",comment="Andy Buy Out")
    // strategy.entry("Andy fandan Short",strategy.short, limit=close,comment="Andy 翻單 short Here")
    // strategy.close("Andy fandan Buy",comment="Andy short Out")


if short_condition
    strategy.entry("Andy Short",strategy.short, limit=close,comment="Andy short Here")


// strategy.exit("STR","Long",stop=longstoploss)
if Exit_short_condition
    strategy.close("Andy Short",comment="Andy short Out")
    // strategy.entry("Andy fandan Buy",strategy.long, limit=close,comment="Andy 翻單 Buy Here")
    // strategy.close("Andy fandan Short",comment="Andy Buy Out")


inLongTrade = strategy.position_size > 0
inLongTradecolor = #58D68D
notInTrade = strategy.position_size == 0
inShortTrade = strategy.position_size < 0

// bgcolor(color = inLongTrade?color.rgb(76, 175, 79, 70):inShortTrade?color.rgb(255, 82, 82, 70):na)
plotshape(close!=0,location = location.bottom,color = inLongTrade?color.rgb(76, 175, 79, 70):inShortTrade?color.rgb(255, 82, 82, 70):na)


plotshape(long_condition, title='Buy', text='Andy Buy', style=shape.labelup, location=location.belowbar, color=color.new(color.green, 0), textcolor=color.new(color.white, 0), size=size.tiny)
plotshape(short_condition, title='Sell', text='Andy Sell', style=shape.labeldown, location=location.abovebar, color=color.new(color.red, 0), textcolor=color.new(color.white, 0), size=size.tiny)


//atr > close *0.01* parameter