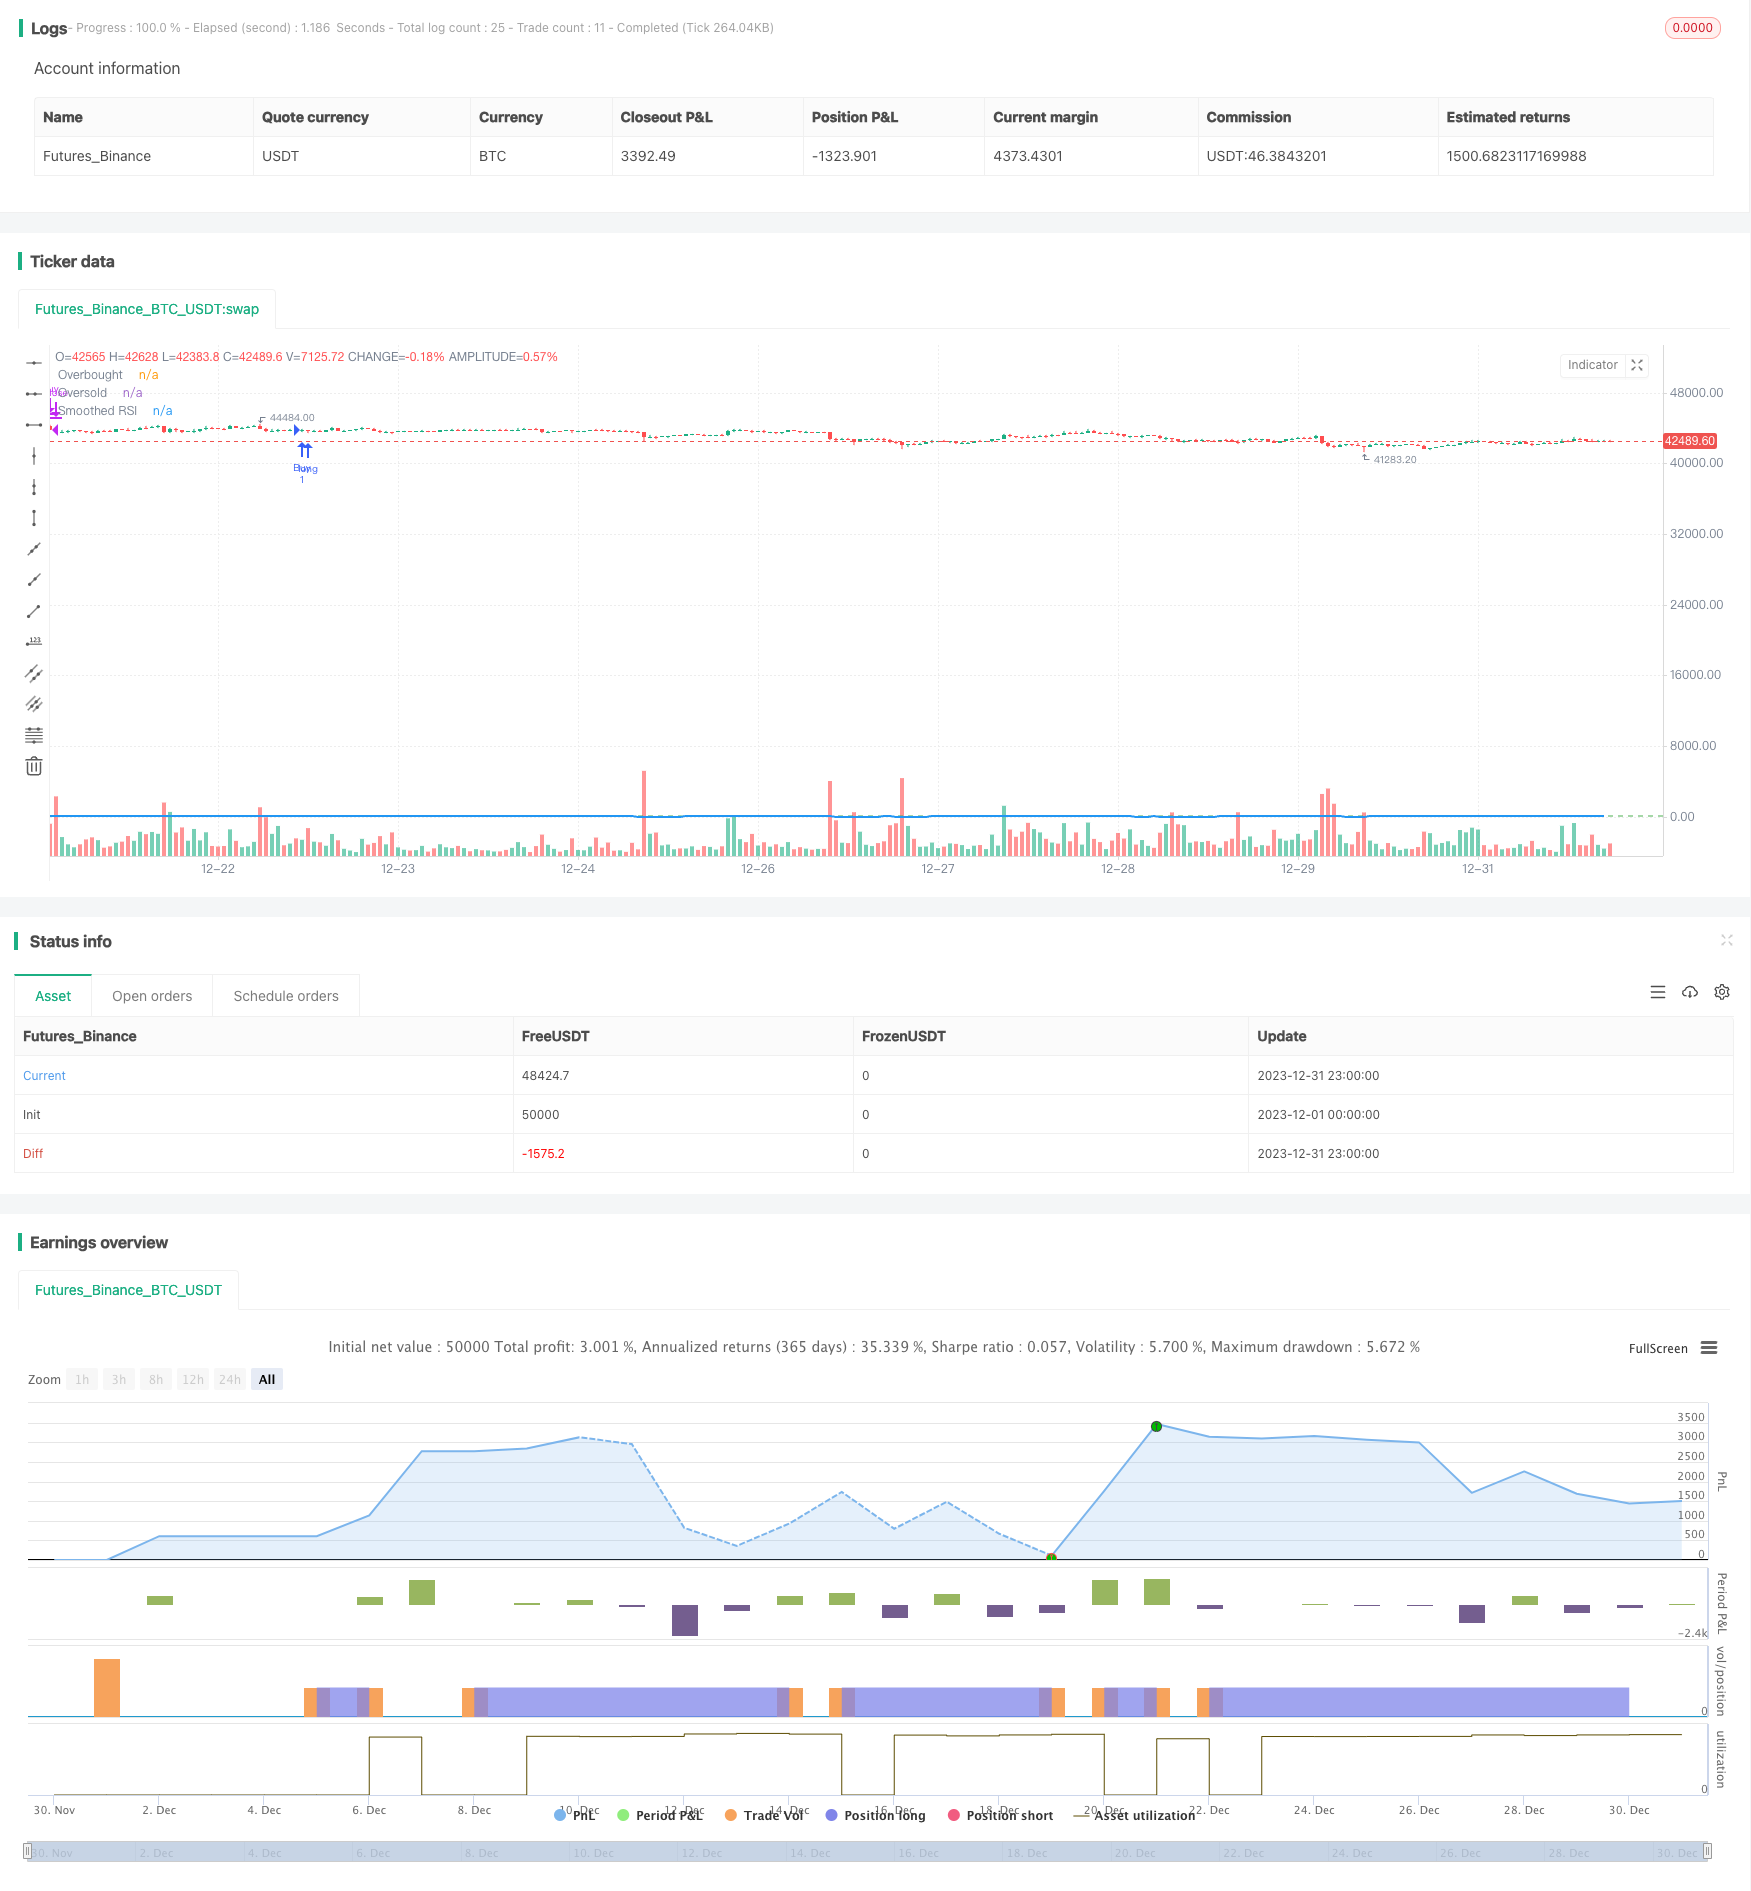
개요
이 전략은 평준화 후 상대적으로 강한 지수 ((RSI) 를 기반으로 구매 및 판매 신호를 결정하기 위해, 비교적 전형적인 추세 추적 전략에 속한다. 특정 기간 동안 주식 가격의 폭이 떨어지는 것을 계산함으로써, 투자자가 시장이 과매매 또는 과매매 상태에 있는지 판단하여 투자 결정을 내릴 수 있도록 도와줍니다.
전략 원칙
- 5일 RSI를 계산해
- RSI 값에 대한 5 일간 간단한 이동 평균으로 RSI 지표가 매끄럽게 된 후
- 80의 오버 바이 라인을 설정하고 40의 오버 세일 라인을 설정합니다.
- 평평한 RSI 상에서 초매도 선을 넘으면 구매 신호가 발생합니다.
- RSI 아래의 평평한 오버 바이 라인을 통과하면 판매 신호가 생성됩니다.
이 전략의 핵심은 평평한 RSI 지표의 설정에 있습니다. RSI 지표는 주식 가격의 초매를 반영 할 수 있습니다. 그러나 원시 RSI 지표는 가격과 함께 급격하게 변동 할 수 있으며 거래 신호를 생성하는 데 도움이되지 않습니다.
우위 분석
- 평평한 RSI 지표는 RSI 지표 자체의 안정성을 강화하여 거래 신호를 더 신뢰할 수있게합니다.
- 간단한 이동 평균을 사용하여 RSI 지표를 평형화하여 변수를 최적화하여 인위적으로 설정된 한계점을 피합니다.
- 오버 바이 오버 셀 영역과 결합하여 시장 상태를 명확하게 판단하여 구매 및 판매 신호를 생성합니다.
- 전략의 구현은 간단하고 이해하기 쉽고 적용하기 쉽습니다.
위험 및 최적화 분석
- 평평한 RSI 지표는 RSI 지표의 감수성을 낮추고, 구매 및 판매 지연을 초래할 수 있습니다.
- 이동 평균의 길이와 오버 바이 오버 시드 값의 설정은 전략의 성능에 영향을 미치며, 변수 최적화가 필요합니다.
- 거래 신호는 가짜 긍정과 가짜 부정으로 나타날 수 있으며, 가격 움직임과 거래량과 같은 요소와 함께 분석되어야 합니다.
- RSI 지표에만 의존하는 것은 전략적 성과를 불안정하게 만들 수 있으며, 다른 기술 지표 또는 기본 지표와 함께 고려할 수 있습니다.
최적화 방향
- 이동 평균 일일 수치를 조정하고 오버 바이 오버 세일 시점, 최적화 파라미터
- MACD, KD 등과 같은 다른 기술 지표를 추가하여 통합 거래 신호를 형성합니다
- 거래량 필터링 메커니즘을 추가하여 가격 변동이 있지만 거래량이 활성화되지 않는 경우 잘못된 신호를 방지합니다.
- 주식 기본 조건과 산업의 경기력으로 결합하여 전략의 안정성을 높여줍니다.
- 손실을 막는 전략을 늘리고, 거래 손실이 일정 수준에 도달하면 손실을 막고, 위험을 통제합니다.
요약하다
이 전략은 RSI 지표를 계산하고 부드럽게 처리하여 합리적인 오버 바이 오버 셀 영역을 설정하여 비교적 명확한 구매 판매 신호를 생성합니다. 원시 RSI 전략에 비해 신호가 더 안정적이고 신뢰할 수있는 장점이 있습니다. 그러나 개선 할 수있는 여지가 있습니다.
전략 소스 코드
/*backtest
start: 2023-12-01 00:00:00
end: 2023-12-31 23:59:59
period: 1h
basePeriod: 15m
exchanges: [{"eid":"Futures_Binance","currency":"BTC_USDT"}]
*/

//@version=5
strategy("Smoothed RSI Strategy", overlay=true)

// Calculate the RSI
length = 5
rsiValue = ta.rsi(close, length)

// Smooth the RSI using a moving average
smoothedRsi = ta.sma(rsiValue, length)

// Define overbought and oversold thresholds
overbought = 80
oversold = 40

// Buy signal when RSI is in oversold zone
buyCondition = ta.crossover(smoothedRsi, oversold)

// Sell signal when RSI is in overbought zone
sellCondition = ta.crossunder(smoothedRsi, overbought)

// Plotting the smoothed RSI
// Plotting the smoothed RSI in a separate pane
plot(smoothedRsi, color=color.blue, title="Smoothed RSI", style=plot.style_line, linewidth=2)

//plot(smoothedRsi, color=color.blue, title="Smoothed RSI")
hline(overbought, "Overbought", color=color.red)
hline(oversold, "Oversold", color=color.green)

// Strategy logic for buying and selling
if (buyCondition)
    strategy.entry("Buy", strategy.long)
if (sellCondition)
    strategy.close("Buy")