개요
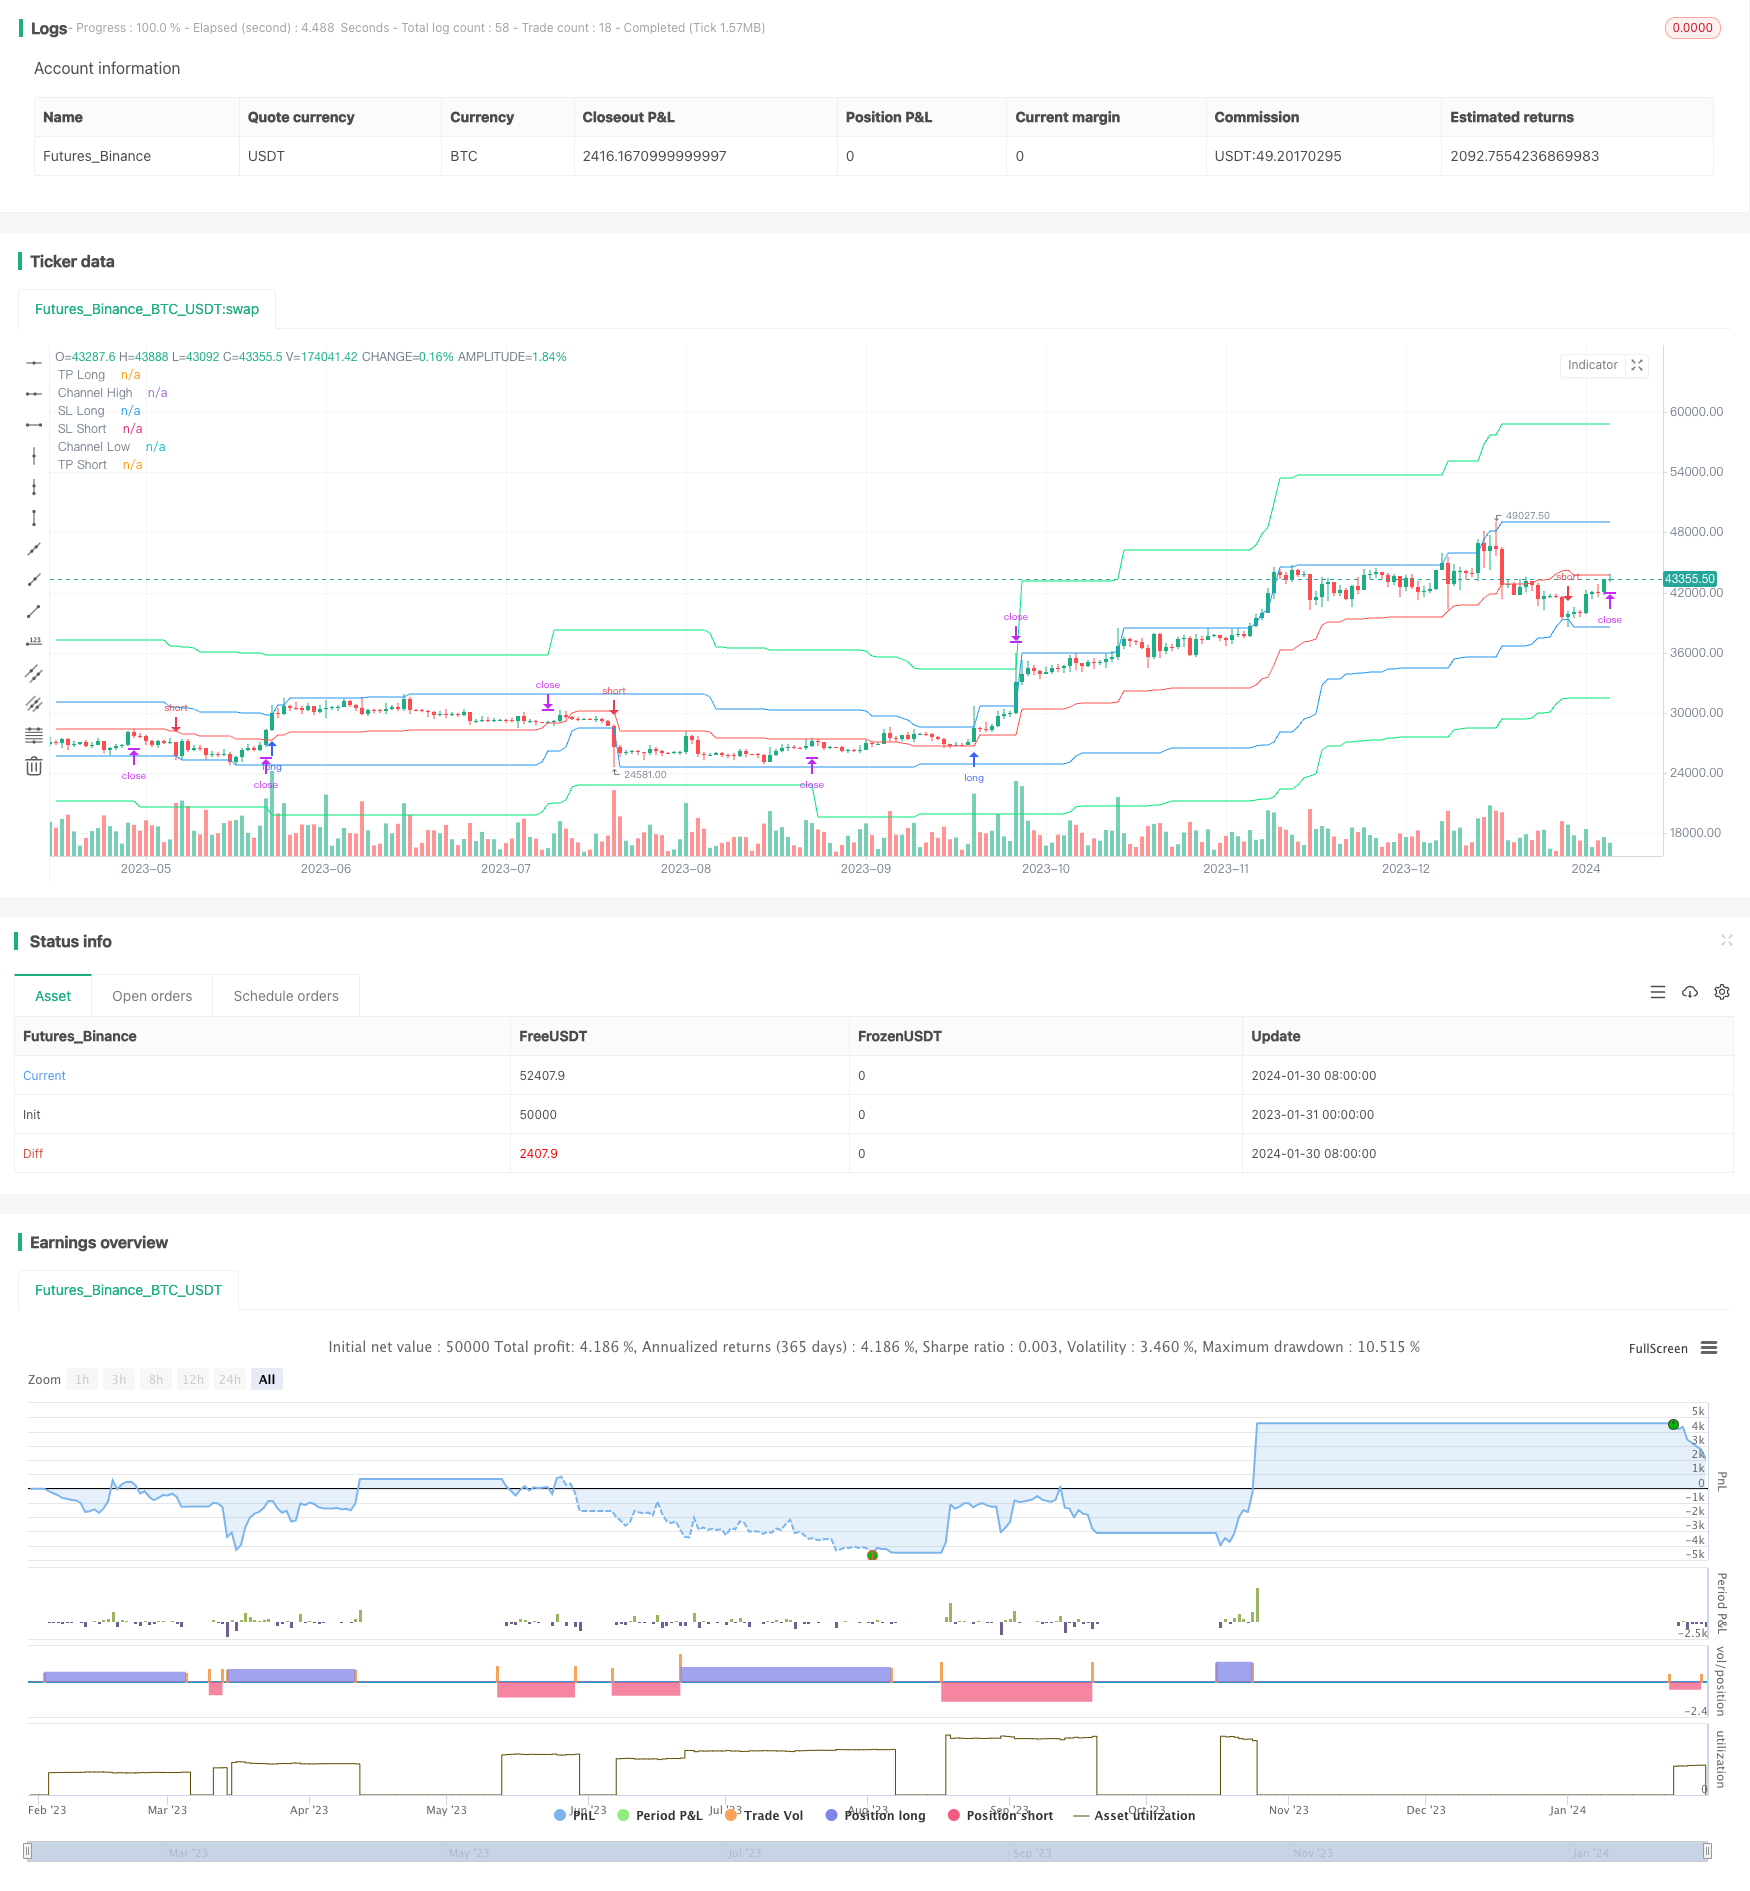
이 전략은 Donchian 가격 채널 지표에 기반하여 개발되었다. 이 지표는 일정 주기 동안의 최고 가격과 최저 가격을 계산하여 가격 채널을 형성한다. 전략은 가격 채널을 활용하여 양방향 거래를 수행하고, 중지 및 중지 가격을 설정한다.
전략 원칙
우선, 전략은 pclen이라는 변수에 따라 가격 통로의 상한h와 하한l을 계산한다. 중선 센터는 가격 통로의 상하한의 평균이다. 그리고는 긴 포지션과 빈 포지션의 정지 변수tp를 기반으로 정지 가격을 tpl와 tps를 계산한다. 정지 가격은 가격 통로의 중선 센터로 고정된다. 가격이 가격 통로를 돌파할 때, 위험 크기에 따라 리스크 롱과 리스크 쇼트를 계산하여 서로 다른 방향으로 거래 포지션을 계산한다.
거래 논리는 다음과 같습니다.
다투자 포지션 개시 신호: 가격이 통로 상한 h보다 높고 통로 내부로 내려가 다투자 포지션을 개시 다수 포지션 평소 포지션 신호: 가격이 채널 중선 center ((스트로피스) 보다 낮거나 스톱 가격 tpl ((스트로피스) 보다 높을 때 평소 포지션
빈 창고 개장 신호: 가격이 통로 하위 제한 l보다 낮아 통로 내로 내려가 빈 창고 개장 빈 포지션 평소 포지션 신호: 가격이 채널 중선 center ((정지 손실) 보다 높거나, 또는 정지 가격 tps ((정지 손실) 보다 낮을 때 평소 포지션
우위 분석
이 전략은 다음과 같은 장점을 가지고 있습니다.
- 양방향 거래는 가격의 역전화를 포착할 수 있습니다.
- 가격 통로를 사용하여 트렌드 방향을 판단하여 가짜 돌파구를 피하십시오.
- 스탠드포드 손실을 설정하고 위험을 제어합니다.
- 포지션 규모와 관련된 리스크 크기를 계산하여 리스크를 제어할 수 있게 한다
- 더 많은 수익을 확보할 수 있는 스톱 및 스톱 손실 추적
위험 분석
이 전략에는 몇 가지 위험도 있습니다.
- 가격 통로 파라미터를 잘못 설정하면 거래 빈도가 너무 높거나 거래 기회를 놓칠 수 있습니다.
- 스톱로즈 가격의 과잉 관대성은 위험 구멍을 증가시킬 수 있다.
- 트래킹 정지는 높은 변동 기간에 조기 발동될 수 있습니다.
이러한 위험은 변수 조정과 인위적인 모니터링을 통해 감소 및 제어할 수 있습니다.
최적화 방향
이 전략은 다음과 같은 부분에서 최적화될 수 있습니다.
- 지표 필터링을 추가하여, 불안정 상황에서 빈번하게 상장하는 것을 방지합니다.
- 다른 스톱스톱 손실 알고리즘을 테스트할 수 있습니다.
- 더 고차원적인 시기를 활용하여 트렌드 방향을 결정하는 시간 주기 간 거래 시스템으로 확장
- 포지션 관리 모듈을 추가하여 자금 사용 비율에 따라 포지션을 조정합니다
- 기계 학습 모델과 결합하여 가격 돌파의 성공률을 판단하여 가짜 돌파를 피합니다.
요약하다
이 전략은 전반적으로 가격 통로 지표를 활용하여 양방향 거래를 실현하는 효과적인 방법입니다. 중지 중지 손실 및 포지션 제어 모듈을 설정하여 위험을 잘 제어 할 수 있습니다. 특정 최적화 및 조정으로 강력한 양적 거래 전략이 될 수 있습니다.
/*backtest
start: 2023-01-31 00:00:00
end: 2024-01-31 00:00:00
period: 1d
basePeriod: 1h
exchanges: [{"eid":"Futures_Binance","currency":"BTC_USDT"}]
*/

//Noro
//2020

//@version=4
strategy(title = "Noro's RiskDonchian Strategy", shorttitle = "RiskDonchian str", overlay = true, default_qty_type = strategy.percent_of_equity, initial_capital = 100, default_qty_value = 100, commission_value = 0.1)

//Settings
needlong = input(true, defval = true, title = "Long")
needshort = input(true, defval = true, title = "Short")
tp = input(defval = 20.0, minval = 1, title = "Take-profit, %")
tptype = input(defval = "2. Fix", options = ["1. None", "2. Fix", "3. Trailing"], title = "Take-profit type")
sltype = input(defval = "2. Center", options = ["1. None", "2. Center"], title = "Take-profit type")
risklong  = input(5.0, minval = 0.0, maxval = 99.9, title = "Risk size for long, %")
riskshort = input(5.0, minval = 0.0, maxval = 99.9, title = "Risk size for short, %")
pclen = input(50, minval = 1, title = "Price Channel Length")
showll = input(true, defval = true, title = "Show lines")
showbg = input(false, defval = false, title = "Show Background")
showof = input(true, defval = true, title = "Show Offset")
showlabel = input(true, defval = true, title = "Show label")
fromyear = input(1900, defval = 1900, minval = 1900, maxval = 2100, title = "From Year")
toyear = input(2100, defval = 2100, minval = 1900, maxval = 2100, title = "To Year")
frommonth = input(01, defval = 01, minval = 01, maxval = 12, title = "From Month")
tomonth = input(12, defval = 12, minval = 01, maxval = 12, title = "To Month")
fromday = input(01, defval = 01, minval = 01, maxval = 31, title = "From day")
today = input(31, defval = 31, minval = 01, maxval = 31, title = "To day")

//Price Channel
h = highest(high, pclen)
l = lowest(low, pclen)
center = (h + l) / 2

//Take-profit
tpl = 0.0
tpl := tptype == "2. Fix" and strategy.position_size > 0 ? tpl[1] : h * (100 + tp) / 100

//Stop-loss
tps = 0.0
tps := tptype == "2. Fix" and strategy.position_size < 0 ? tps[1] : l * (100 - tp) / 100

//Lines
tplcol = showll and needlong and tptype != "1. None" ? color.lime : na
pclcol = showll and needlong ? color.blue : na
sllcol = showll and needlong and sltype != "1. None" ? color.red : na
tpscol = showll and needshort and tptype != "1. None" ? color.lime : na
pcscol = showll and needshort ? color.blue : na
slscol = showll and needshort and sltype != "1. None" ? color.red : na
offset = showof ? 1 : 0
plot(tpl, offset = offset, color = tplcol, title = "TP Long")
plot(h, offset = offset, color = pclcol, title = "Channel High")
plot(center, offset = offset, color = sllcol, title = "SL Long")
plot(center, offset = offset, color = slscol, title = "SL Short")
plot(l, offset = offset, color = pcscol, title = "Channel Low")
plot(tps, offset = offset, color = tpscol, title = "TP Short")

//Background
size = strategy.position_size
bgcol = showbg == false ? na : size > 0 ? color.lime : size < 0 ? color.red : na
bgcolor(bgcol, transp = 70)

//Lot size
risksizelong = -1 * risklong
risklonga = ((center / h) - 1) * 100
coeflong = abs(risksizelong / risklonga)
lotlong = (strategy.equity / close) * coeflong
risksizeshort = -1 * riskshort
riskshorta = ((center / l) - 1) * 100
coefshort = abs(risksizeshort / riskshorta)
lotshort = (strategy.equity / close) * coefshort

//Trading
truetime = time > timestamp(fromyear, frommonth, fromday, 00, 00) and time < timestamp(toyear, tomonth, today, 23, 59)
mo = 0
mo := strategy.position_size != 0 ? 0 : high >= center[1] and low <= center[1] ? 1 : mo[1]

if h > 0
    longlimit = tptype == "1. None" ? na : tpl
    longstop = sltype == "1. None" ? na : center
    strategy.entry("Long", strategy.long, lotlong, stop = h, when = strategy.position_size <= 0 and needlong and truetime and mo)
    strategy.exit("TP Long", "Long", limit = longlimit, stop = longstop)
    shortlimit = tptype == "1. None" ? na : tps
    shortstop = sltype == "1. None" ? na : center
    strategy.entry("Short", strategy.short, lotshort, stop = l, when = strategy.position_size >= 0 and needshort and truetime and mo)
    strategy.exit("Exit Short", "Short", limit = shortlimit, stop = shortstop)
if time > timestamp(toyear, tomonth, today, 23, 59)
    strategy.close_all()
    strategy.cancel("Long")
    strategy.cancel("Short")

if showlabel

    //Drawdown
    max = 0.0
    max := max(strategy.equity, nz(max[1]))
    dd = (strategy.equity / max - 1) * 100
    min = 100.0
    min := min(dd, nz(min[1]))

    //Label
    min := round(min * 100) / 100
    labeltext = "Drawdown: " + tostring(min) + "%"
    var label la = na
    label.delete(la)
    tc = min > -100 ? color.white : color.red
    osx = timenow + round(change(time)*10)
    osy = highest(100)