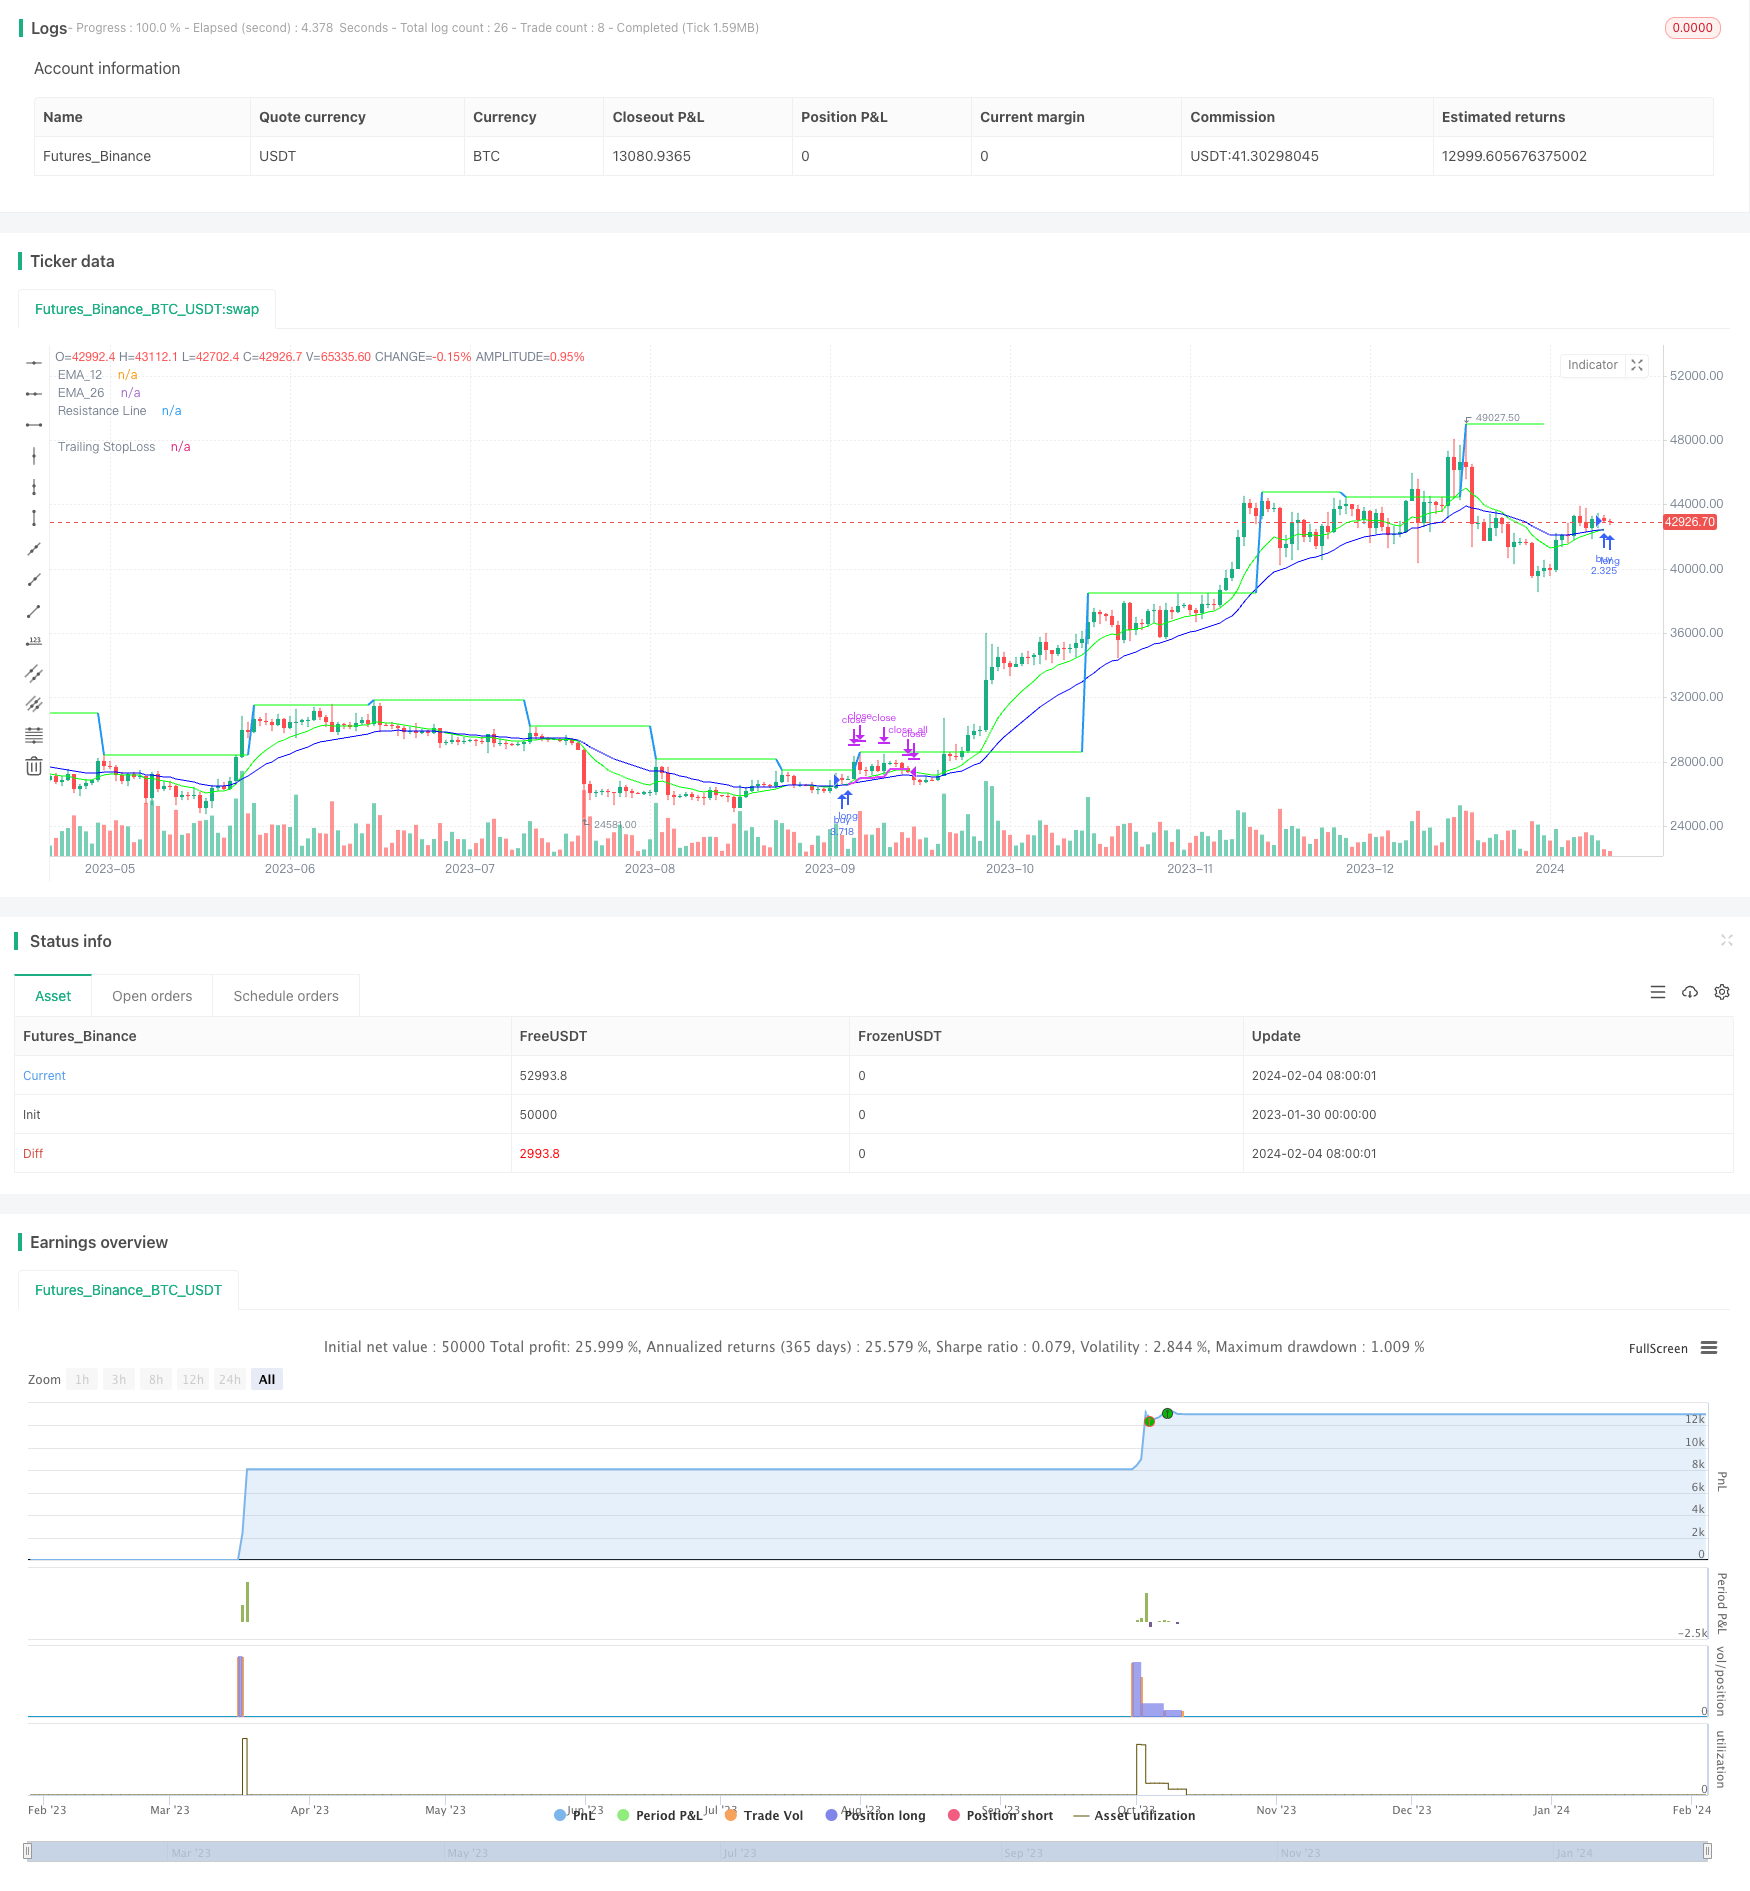
개요
이 전략은 12일 지수 이동 평균 (((EMA) 와 26일 EMA의 금강을 입력 신호로 사용합니다. 가짜 돌파구를 필터링하기 위해, 전략은 또한 시장 추세를 판단하는 MACD 지표와 RSI 지표가 과매도 과매도 영역에 있는지 판단하는 것을 도입합니다. 동시에, 전략은 가격을 판단합니다.
스톱의 경우, 전략은 세 가지 옵션이 있습니다: 추적 스톱, 일률 스톱 및 일률 포크. 스톱의 경우, 전략은 두 가지 순서적 스톱 목표를 제공합니다.
전략 원칙
출입 신호
- 12일 EMA 상단 26일 EMA 금강
- MACD 지표가 긍정적이고 MACD 라인은 신호 라인보다 높습니다.
- RSI 값은 설정된 범위내에서
- 21일 EMA와 7일 SMA보다 높은 마감 가격
입국 확인
- 선택적 판단: 가격의 역동적 저항점을 돌파함
손해 방지 방법
- 트래킹 스톱 로드: 입점 가격과 설정된 트래킹 스톱 로드 비율에 따라 트래킹 스톱 로드를 설정
- 평균자책점 상쇄상황: 7일 SMA 상쇄상황
- 평균선 포크 사망: 12일 EMA 아래 26일 EMA 정지
정지방법
- 두 개의 순차적인 정지 목표를 설정하여 첫 번째 정지가 촉발되면 일부 양을 판매하고 두 번째 정지가 촉발되면 전체 양을 판매합니다.
전략적 이점
- 평균선 시스템 필터링을 사용하여 오도 신호를 필터링하여 진입 정확도를 향상시킵니다.
- 다양한 유형의 거래자를 위한 여러 가지 선택 가능한 중지 방법
- 동적 추적 중지 손실
- “이번 경기에서 우승을 차지할 수 있는 기회를 얻었다”고 말했다.
전략적 위험
- 시장이 흔들릴 때, EMA 지표는 더 많은 가짜 신호를 만들어 냅니다.
- 트래킹 스톱 손실은 브레이크 라인 이후 뚫릴 수 있습니다.
- 평균선 포크 정지 손실이 트렌드 반전 시 정지되지 않습니다.
대응책:
- MACD 지표와 함께 시장의 실제 흐름을 판단하는 방법
- 트래킹 손실을 조정합니다.
- 선택적 또는 결합된 경감 방법
전략 최적화 방향
- EMA 변수를 최적화하여 최적의 변수 조합을 결정합니다.
- 다양한 손해 방지 방법과 매개 변수를 테스트하여 최적의 손해 방지 방법을 찾습니다.
- 다양한 차단 매개 변수를 테스트하여 차단 효과를 최적화합니다.
- 다른 지표들과 함께 진출 시기를 판단하는 것
- 다른 품종, 주기 파라미터에 따라 조정
요약하다
이 전략은 평행선 시스템을 주요 거래 신호로 사용하여 MACD, RSI 등의 지표로 입문 필터링을 보조합니다. 중지 방법과 중지 목표가 모두 최적화되어 있으며, 파라미터를 조정하여 다른 유형의 투자자를 일치시킬 수 있습니다. 전략 최적화 공간은 넓고, 입문 신호, 중지 방법, 중지 목표 등 여러 차원에서 테스트 및 개선하여 전략 효과를 향상시킬 수 있습니다.
전략 소스 코드
/*backtest
start: 2023-01-30 00:00:00
end: 2024-02-05 00:00:00
period: 1d
basePeriod: 1h
exchanges: [{"eid":"Futures_Binance","currency":"BTC_USDT"}]
*/

// This source code is subject to the terms of the Mozilla Public License 2.0 at https://mozilla.org/MPL/2.0/
// © AbdulRahimShama
//@version=5


strategy('12/26-IT strategy', overlay=true,initial_capital = 100000)


Show_Only_12_26_Crossover_Entry = input.bool(true, group = "Entry_Exit Criteria")
Show_12_26_Crossover_and_resistance_Entry = input.bool(false, group = "Entry_Exit Criteria")


Show_TSL_StopLoss = input.bool(true, group = "Entry_Exit Criteria")
Show_Crossdown_StopLoss = input.bool(true, group = "Entry_Exit Criteria")
Show_SMA7_StopLoss = input.bool(false, group = "Entry_Exit Criteria")


////////////////////////////////////////////////
////////////////TARGETS INPUT
////////////////////////////////////////////////

////////Target1

TargetPerc1 = input.float(title="Target (%)", minval=0,defval=5, group="Target-1") / 100
TargetPrice1 = strategy.position_avg_price * (1 + TargetPerc1)
Target1_exit_qty = input.int(50, group="Target-1",tooltip = "% qty to sell when Target1 is reached")


////////Target2

TargetPerc2 = input.float(title="Target (%)", minval=0,defval=10, group="Target-2") / 100
TargetPrice2 = strategy.position_avg_price * (1 + TargetPerc2)
Target2_exit_qty = input.int(100, group="Target-2",tooltip = "% qty to sell when Target2 is reached")


////////////////////////////////////////////////
////////////////TRAILING STOP LOSS
////////////////////////////////////////////////


TSLsource = input(low, title="TSL Source", group="Trailing StopLoss")

longTrailPerc = input.float(title='Trail Long Loss (%)', minval=0.0, step=0.1, defval=1, group="Trailing StopLoss") * 0.01

TrailStopPrice = 0.0

TrailStopPrice := if strategy.position_size > 0
    sPIVOT_highValue = TSLsource * (1 - longTrailPerc)
    math.max(sPIVOT_highValue, TrailStopPrice[1])
else
    0

TSL = close < TrailStopPrice
plot(series=strategy.position_size > 0 and Show_TSL_StopLoss ? TrailStopPrice : na, color=color.new(color.fuchsia, 0), style=plot.style_linebr, linewidth=2, title='Trailing StopLoss')


////////////////////////////////////////////////
////////////////Moving Averages
////////////////////////////////////////////////


EMA_12=ta.ema(close, 12)
EMA_26=ta.ema(close, 26)
EMA_21=ta.ema(close,21)

plot(EMA_12, title="EMA_12", color=color.rgb(0, 255, 0), offset=0, linewidth=1)
plot(EMA_26, title="EMA_26", color=color.rgb(0, 0, 255), offset=0, linewidth=1)
plot(Show_SMA7_StopLoss ? ta.sma(close,7) : na, title="SMA_7", color=color.rgb(255, 0, 0), offset=0, linewidth=1)


////////////////////////////////////////////////
////////////////RESISTANCE INPUT and PLOTTING
////////////////////////////////////////////////

CrossOverLookbackCandles = input.int(10, group= "RESISTANCE")

resistanceSRC = input(high, group= "RESISTANCE")
resistanceLEFT = input(10, group= "RESISTANCE")
resistanceRIGHT = input(10, group= "RESISTANCE")

hih = ta.pivothigh(resistanceSRC, resistanceLEFT, resistanceRIGHT)
top = ta.valuewhen(hih, resistanceSRC[resistanceRIGHT], 0)

res = plot(top, color=top != top[1] ? na : color.new(#00ff00, 50), offset=-resistanceLEFT, linewidth=2, title="Resistance Line")

EMA_12_Low = ta.lowest(EMA_12, CrossOverLookbackCandles)
EMA_26_Low = ta.lowest(EMA_26, CrossOverLookbackCandles)


////////////////////////////////////////////////
////////////////RSI INPUT and PLOTTING
////////////////////////////////////////////////
RSI = ta.rsi(close, 14)
RSILowerRange = input.int(50, tooltip = "RSI value should be ABOVE this value for entry", group = "RSI")
RSIUpperRange = input.int(70, tooltip = "RSI value should be BELOW this value for entry", group = "RSI")


////////////////////////////////////////////////
////////////////MACD
////////////////////////////////////////////////
fast_length = 12
slow_length = 26
MACD_src = close
signal_length = 9

fast_ma = ta.ema(MACD_src, fast_length)
slow_ma = ta.ema(MACD_src, slow_length)
macd = fast_ma - slow_ma
signal = ta.ema(macd, signal_length)
hist = macd - signal


////////////////////////////////////////////////
////////////////ENTRY CRITERIA
////////////////////////////////////////////////


BUYVALUE= input(100000, tooltip = "Buy qty displayed on chart will be based on this value")

BASEENTRY = macd > signal and RSI > RSILowerRange and RSI < RSIUpperRange and close > EMA_21 and close > ta.sma(close, 7)


Entry= ta.crossover(EMA_12, EMA_26) and BASEENTRY
Entry2 = ta.crossover(close, top) and EMA_12_Low < EMA_26_Low and EMA_12 > EMA_26 and RSI < 70

////////////////////////////////////////////////
////////////////BUY SELL STRATEGY
////////////////////////////////////////////////

if ((Entry and Show_Only_12_26_Crossover_Entry))
    strategy.entry("buy", strategy.long, qty=BUYVALUE/close)

if (Entry2 and Show_12_26_Crossover_and_resistance_Entry)
    strategy.entry("buy", strategy.long, qty=BUYVALUE/close)

strategy.exit("Tg1", "buy", limit=TargetPrice1, qty_percent = Target1_exit_qty)
strategy.exit("Tg2", "buy", limit=TargetPrice2, qty_percent = Target2_exit_qty)


if TSL and Show_TSL_StopLoss and close < EMA_12
    strategy.close_all ("sl")

if ta.crossunder(EMA_12, EMA_26) and Show_Crossdown_StopLoss
    strategy.close_all ("sl")

if ta.crossunder(close, ta.sma(close, 7)) and Show_SMA7_StopLoss
    strategy.close_all ("sl")