모멘텀 절대 가치 지표 전략

개요
동력 절대 가치 지표 전략은 투샤르 찬데가 개발한 동력 지표 CMO의 개선된 버전이다. 이 전략은 가격의 절대 동력 값을 계산하여 시장이 현재 과매도 또는 과매도 상태에 있는지 판단하여 시장의 중간 가격 변동을 포착한다.
전략 원칙
이 전략의 핵심 지표는 개량된 CMO 지표인 AbsCMO이다. AbsCMO의 계산 공식은 다음과 같다.
AbsCMO = abs(100 * (最新收盘价 - Length周期前的收盘价) / (Length周期内价格波动绝对值的简单移动平均 * Length))
그 중, Length는 평균 기간의 길이를 나타냅니다. AbSCMO 값은 0에서 100까지입니다. 이 지표는 동력의 방향성과 강도의 monumentality를 결합하여 시장의 중기 추세와 과매매 영역을 명확하게 판단합니다.
AbsCMO 위가 지정된 상반도를 넘어서면 (설정된 70), 시장이 오버 바이를 걸고, 상반도를 다룹니다. AbsCMO 아래가 지정된 하반도를 넘어서면 (설정된 20), 시장이 오버 세일을 걸고, 상반도를 다룹니다.
우위 분석
다른 동력 지표에 비해 AbsCMO 지표는 다음과 같은 장점이 있습니다.
- 가격의 절대적 동력을 반영하여 시장의 중기 추세를 더 정확하게 판단할 수 있습니다.
- "지향성과 강도를 결합하면 과매매를 더 명확하게 식별할 수 있습니다".
- 제한 범위는 0-100이며, 여러 품종 간의 비교가 더 적합합니다.
- 시장의 중기적 추세에 반응하여 단기적 급격한 변동에 민감하지 않습니다.
- 사용자 정의 가능한 파라미터, 적응력이 강하다.
위험 분석
이 전략에는 다음과 같은 위험들이 있습니다.
- 중간 지표는 단기 변동에 민감하지 않습니다.
- 모든 품종에 적합하지 않은 기본 파라미터는 최적화가 필요합니다.
- 장기간 지분을 유지하면 더 큰 인출이 발생할 수 있습니다.
포지션 주기를 적절히 줄이고, 매개 변수를 최적화하거나, 다른 지표와 함께 사용함으로써 위험을 줄일 수 있다.
최적화 방향
이 전략은 다음과 같은 부분에서 최적화될 수 있습니다.
- 더 많은 품종을 수용하기 위해 AbsCMO의 매개 변수를 최적화합니다.
- 다른 지표와 함께 가짜 신호를 필터링합니다.
- 위험 관리에 대한 상쇄 및 차단 규칙을 정하고
- 딥러닝과 같은 기술과 결합하여 더 나은 입시점을 찾아보세요.
요약하다
동력 절대 가치 지표 전략은 전체적으로 비교적 실용적인 중기 거래 전략이다. 가격의 중기 절대 동력 특성에 반응하여 시장의 중기 경향을 판단하는 판단력이 강하다. 그러나 이 전략은 단기간의 급격한 변동에 민감하지 않으며, 일정한 위험이 있다. 변수 최적화, 지표 필터링, 상쇄 메커니즘 등의 추가적인 개선을 통해 이 전략의 실장 성과를 더 안정적으로 신뢰할 수 있다.
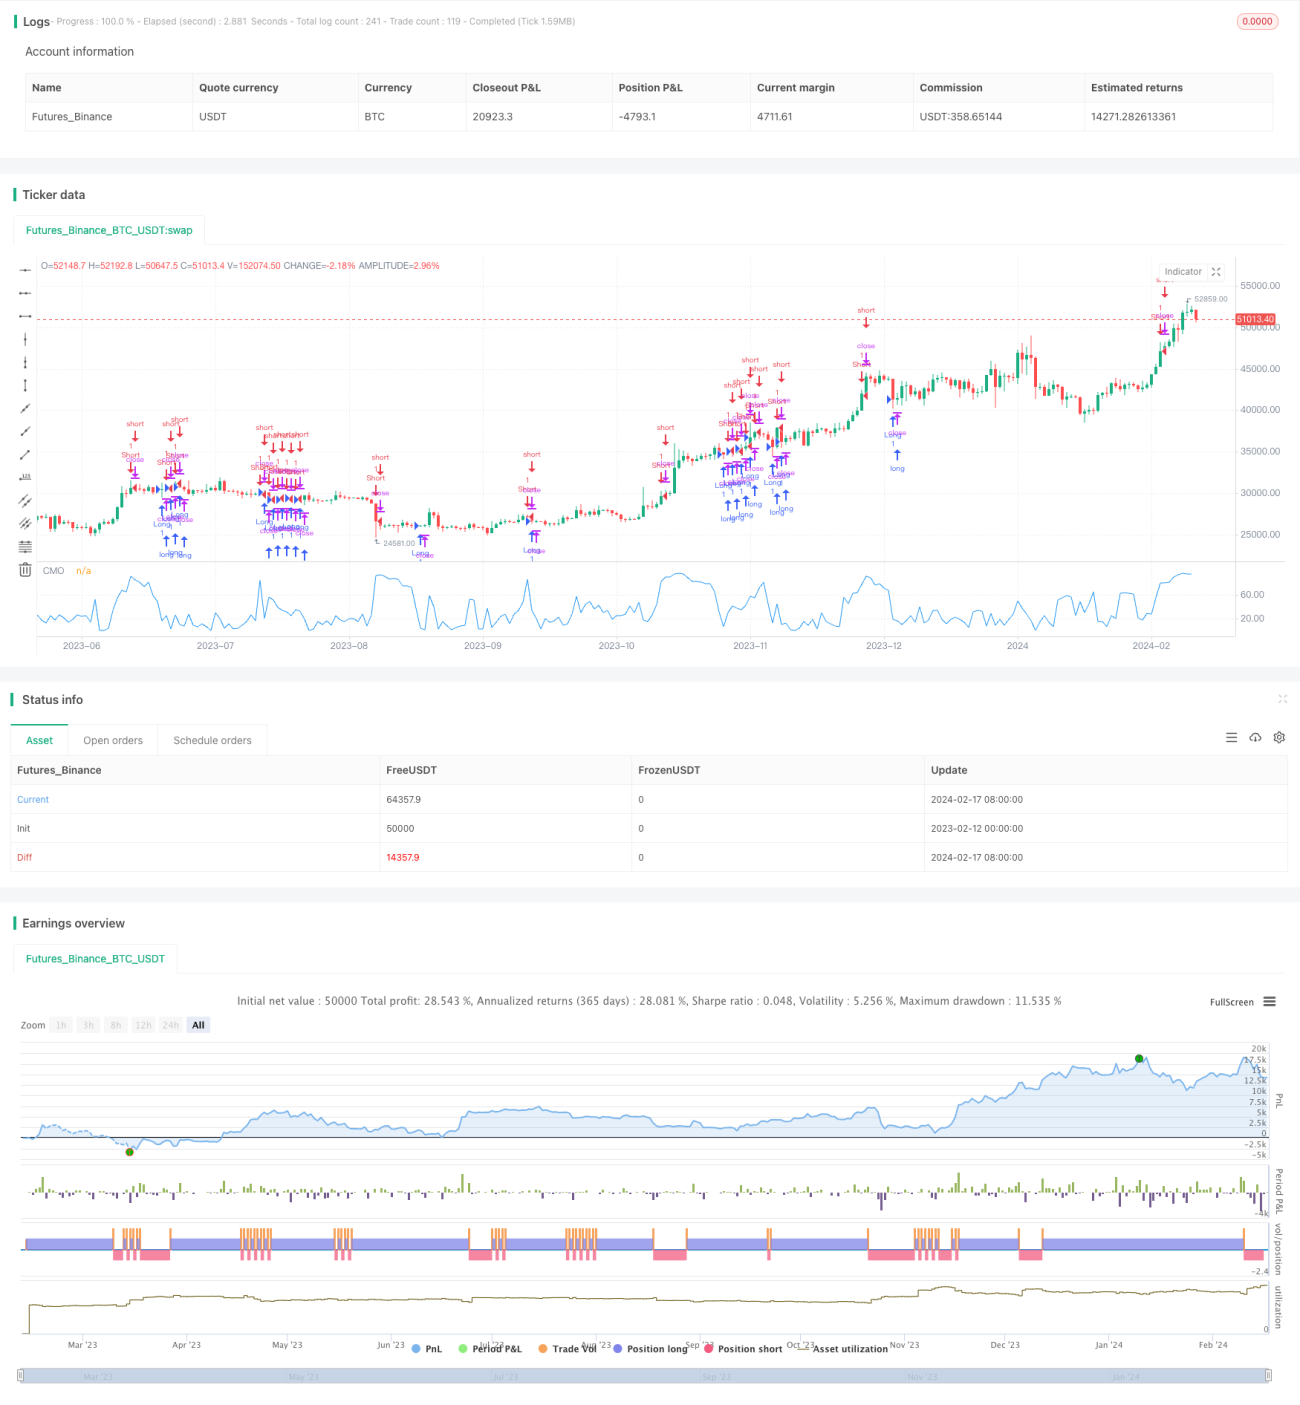
/*backtest
start: 2023-02-12 00:00:00
end: 2024-02-18 00:00:00
period: 1d
basePeriod: 1h
exchanges: [{"eid":"Futures_Binance","currency":"BTC_USDT"}]
*/

//@version=2
////////////////////////////////////////////////////////////
//  Copyright by HPotter v1.0 17/02/2017
// This indicator plots the absolute value of CMO. CMO was developed by Tushar - 1