개요
이 전략은 가격과 SMA의 교차를 기반으로 한 양적 거래 전략으로, 주로 다른 주기의 SMA를 계산하고 가격과 SMA의 교차 상황을 추적하여 거래 신호를 생성합니다. 가격이 아래에서 위로 SMA를 돌파하면 구매 신호를 생성합니다. 가격이 위에서 아래로 내려가 SMA를 돌파하면 판매 신호를 생성합니다.
전략 원칙
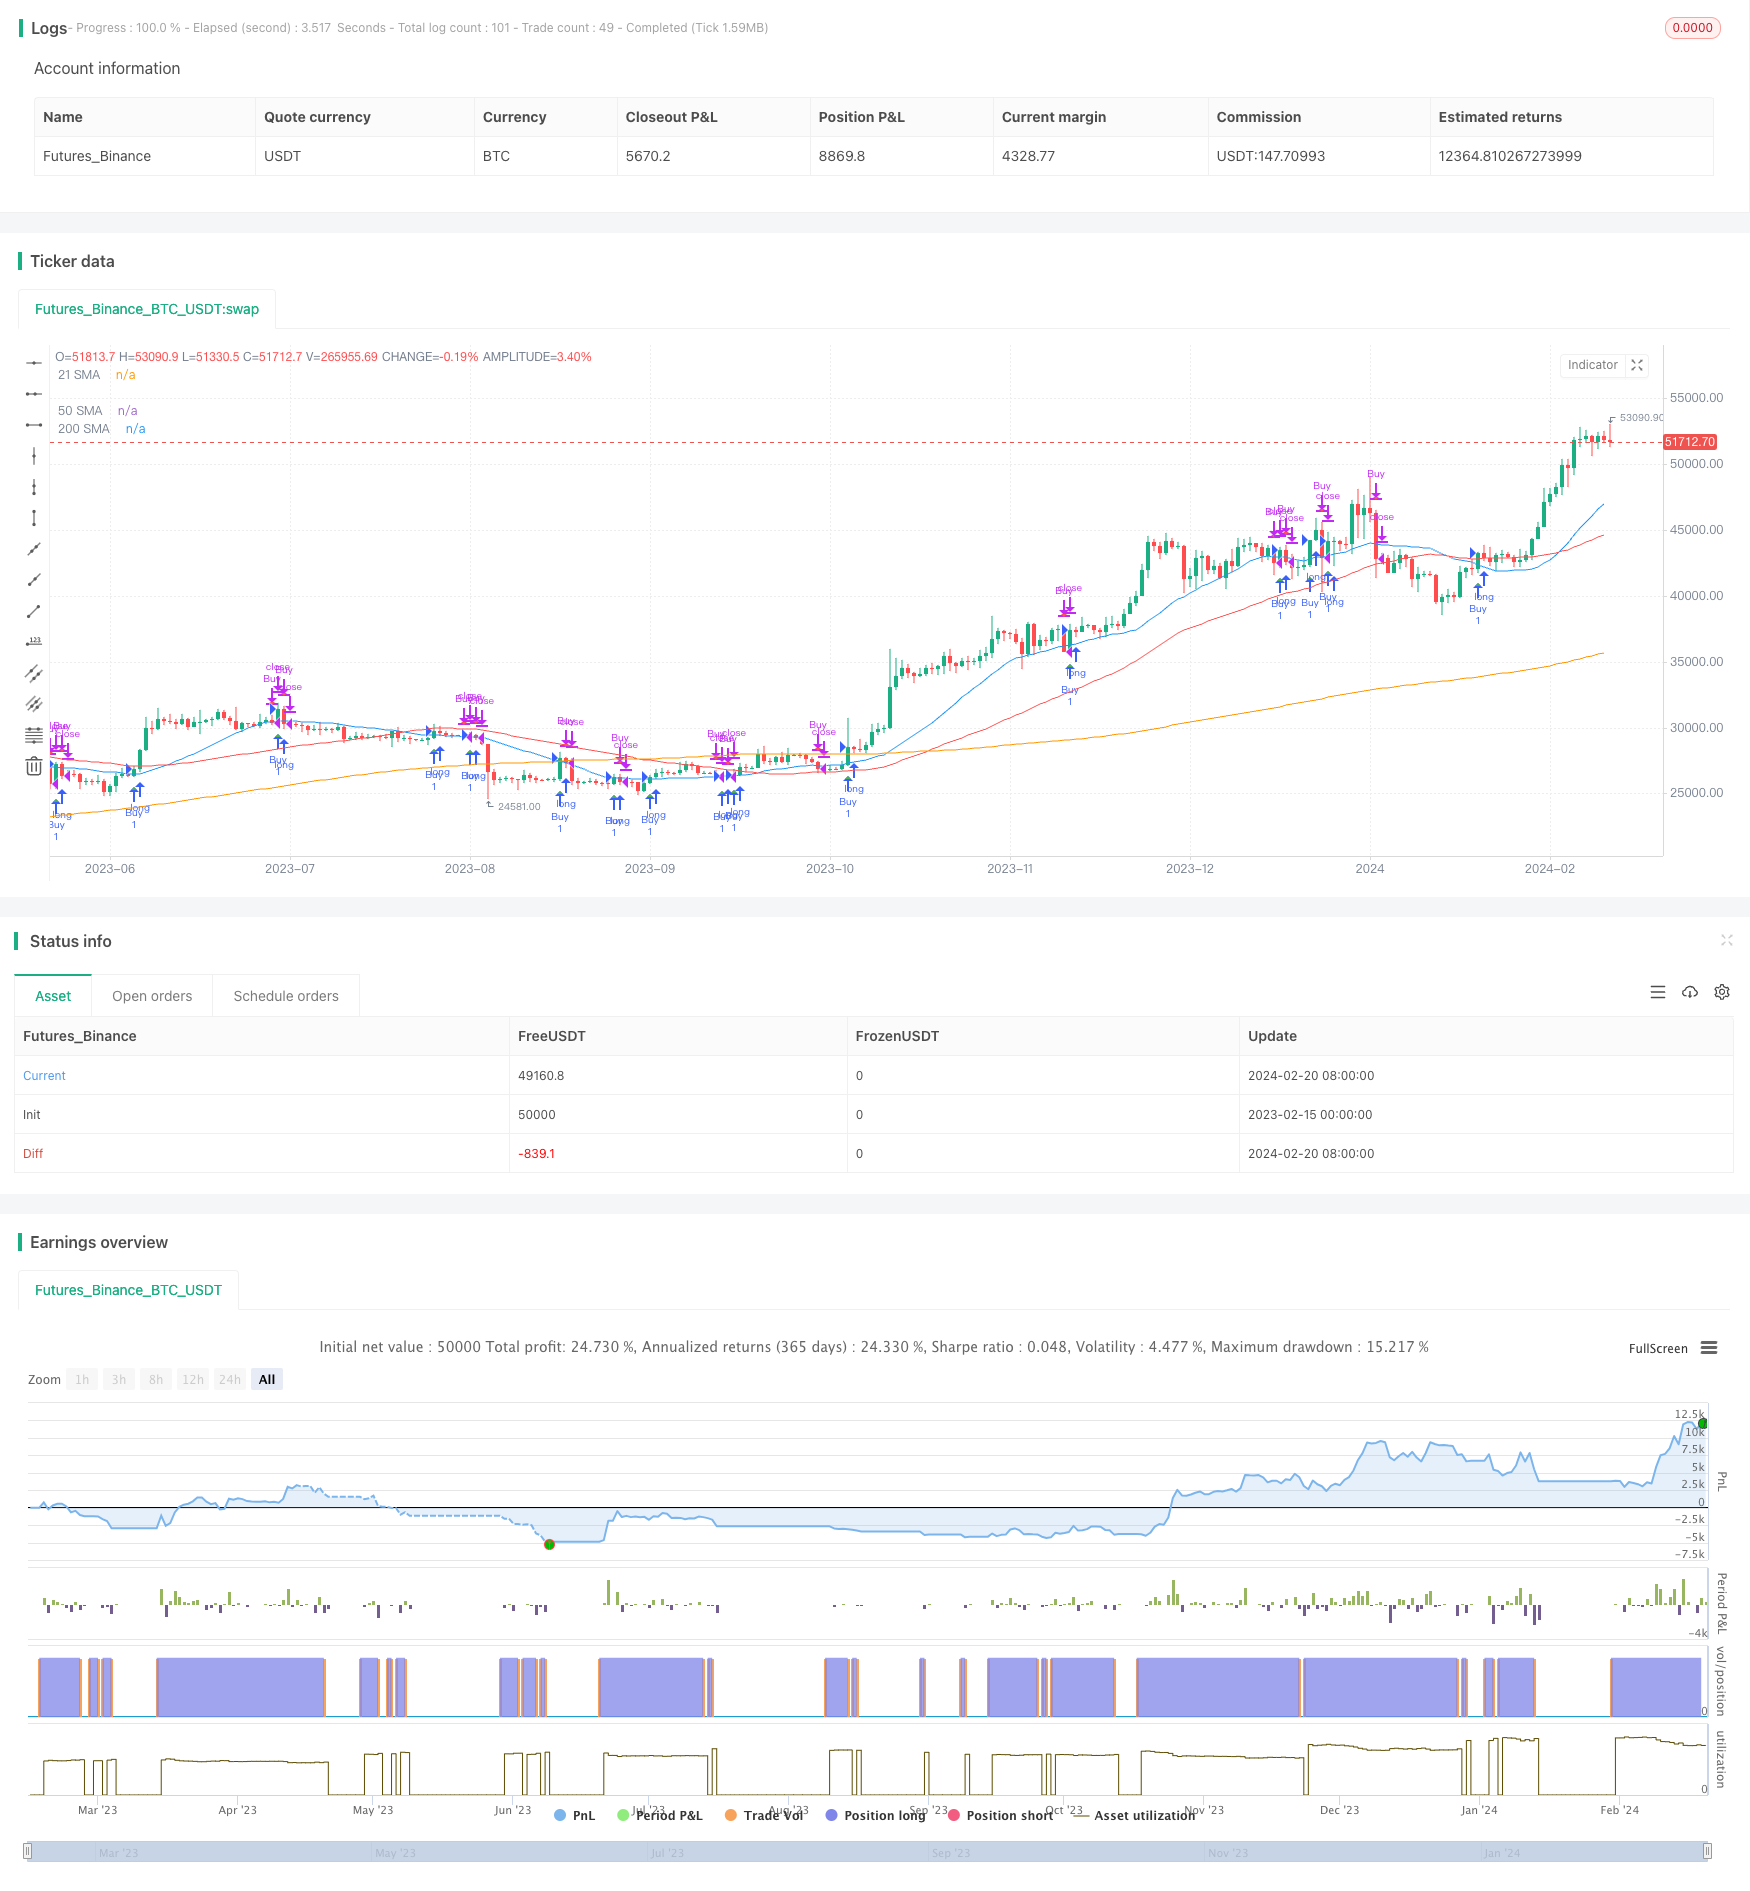
이 전략의 핵심 논리는 가격과 21일 간단한 이동 평균 (SMA) 의 교차 상황을 추적하는 것입니다. 동시에, 전략은 50일 SMA와 200일 SMA를 계산하여 대략적인 추세를 판단하는 데 도움이됩니다.
구체적으로, 전략은 지정된 날짜 범위 내의 종결 가격을 얻기 위해 요청하고, 입력된 SMA 주기를 기반으로 다른 SMA를 계산한다. 가격이 아래에서 위로 21일 SMA를 돌파하면 구매 신호를 설정하고, 가격이 위에서 아래로 21일 SMA를 돌파하면 판매 신호를 설정한다.
SMA를 계산하고 교차를 판단하는 동시에, 전략은 현재 포지션 상태를 추적한다. 구매 신호가 촉발되면 전략은 포지션에 들어간다. 판매 신호가 촉발되면 전략은 포지션을 평정한다. 이 방법으로, SMA 교차 시스템을 기반으로 한 자동 거래를 완료한다.
우위 분석
이 전략의 가장 큰 장점은 간단하고 쉽게 이해하고 구현할 수 있다는 것입니다. SMA는 일반적으로 사용되는 기술적 분석 지표이며, SMA 교차는 일반적인 거래 신호 중 하나입니다. 이 지표 교차 기반의 전략은 다양한 주식과 시간 범위에 쉽게 적용되어 자동화 거래에 적합합니다.
또 다른 장점은 이 전략이 SMA 매개 변수를 조정하여 최적화 할 수 있다는 것입니다. 예를 들어, 특정 주식의 변동 법칙에 맞는 최적의 매개 변수를 찾기 위해 다양한 SMA 주기 조합을 테스트 할 수 있습니다. 또한, 전략은 다른 지표를 추가하여 확증 및 최적화를 수행 할 수 있습니다.
위험과 해결책
이 전략의 가장 큰 위험은 지표형 전략이 잘못된 신호를 더 많이 생성한다는 것입니다. 예를 들어, 축적된 충격 기간 동안 가격은 종종 지상 아래 SMA를 통과하여 불필요한 거래 신호를 유발할 수 있습니다.
일반적인 해결 방법은 스톱로스를 설정하고, 파라미터를 조정하거나, 필터 조건을 추가하는 등이다. 예를 들어, 최대 손실 비율을 설정하여 위험을 제한할 수 있다. 또한 SMA 주기를 조정하여 더 안정적인 파라미터 조합을 선택할 수 있다. 또는 다른 지표의 확인을 추가하여 부분 신호를 필터링 할 수 있다.
최적화 방향
이 전략은 다음과 같은 방향으로 최적화될 수 있습니다.
테스트하고 최적의 SMA 파라미터 조합을 선택하십시오. 다양한 SMA 길이를 재검토하여 가장 적합한 주기를 찾을 수 있습니다.
RSI, MACD 등과 같은 다른 지표 FilterSignal confirmation를 추가하십시오. 이것은 잘못된 신호를 필터링 할 수 있습니다.
스톱 로직을 추가한다. 최대 허용 손실을 설정하거나 스톱을 이동하면 위험을 제어할 수 있다.
진입 시기를 최적화한다. 중요한 돌파구 근처에 진입하는 것을 고려할 수 있으며, SMA 교차를 엄격히 추적하는 것을 고려할 수 없다.
복합 전략을 테스트한다. 트렌드 추적과 같은 다른 유형의 전략과 함께 사용할 수 있다.
요약하다
이 전략은 간단한 SMA 지표 교차를 통해 자동 거래를 구현합니다. 장점은 간단하고 이해하기 쉽다는 것입니다. 단점은 신호가 빈번하고 쉽게 조작된다는 것입니다. 우리는 매개 변수를 최적화하고 필터를 추가하여 전략 효과를 향상시킬 수 있습니다.
/*backtest
start: 2023-02-15 00:00:00
end: 2024-02-21 00:00:00
period: 1d
basePeriod: 1h
exchanges: [{"eid":"Futures_Binance","currency":"BTC_USDT"}]
*/

//@version=5
strategy("Price Cross Above/Below SMA Strategy", shorttitle="Tressy Strat", overlay=true)

// Define start and end year inputs
start_year = input.int(2022, title="Start Year")
end_year = input.int(2022, title="End Year")

// Define start and end month inputs
start_month = input.int(1, title="Start Month", minval=1, maxval=12)
end_month = input.int(12, title="End Month", minval=1, maxval=12)

// Define SMA length inputs
sma_length = input.int(21, title="SMA Length")
sma_length_50 = input.int(50, title="50 SMA Length")
sma_length_200 = input.int(200, title="200 SMA Length")

// Filter data within the specified date range
filter_condition = true
filtered_close = request.security(syminfo.tickerid, "D", close[0], lookahead=barmerge.lookahead_on)

// Define SMAs using the input lengths
sma = ta.sma(filtered_close, sma_length)
sma_50 = ta.sma(filtered_close, sma_length_50)
sma_200 = ta.sma(filtered_close, sma_length_200)

// Initialize position
var bool in_position = false

// Condition for a price cross above SMA within the date range
cross_above = filter_condition and ta.crossover(filtered_close, sma)

// Condition for a price cross below SMA within the date range
cross_below = filter_condition and ta.crossunder(filtered_close, sma)

// Buy condition
if cross_above
    in_position := true

// Sell condition
if cross_below
    in_position := false

// Strategy entry and exit
if cross_above
    strategy.entry("Buy", strategy.long)
if cross_below
    strategy.close("Buy")

// Plot the SMAs on the chart
plot(sma, color=color.blue, title="21 SMA")
plot(sma_50, color=color.red, title="50 SMA")
plot(sma_200, color=color.orange, title="200 SMA")

// Plot the Buy and Sell signals with "tiny" size
plotshape(cross_above, style=shape.triangleup, location=location.belowbar, color=color.green, size=size.tiny, title="Buy Signal")
plotshape(cross_below, style=shape.triangledown, location=location.abovebar, color=color.red, size=size.tiny, title="Sell Signal")