Strategi Perdagangan Penyu Pelarian Purata Pergerakan Hibrid

1
Follow
1778
Followers
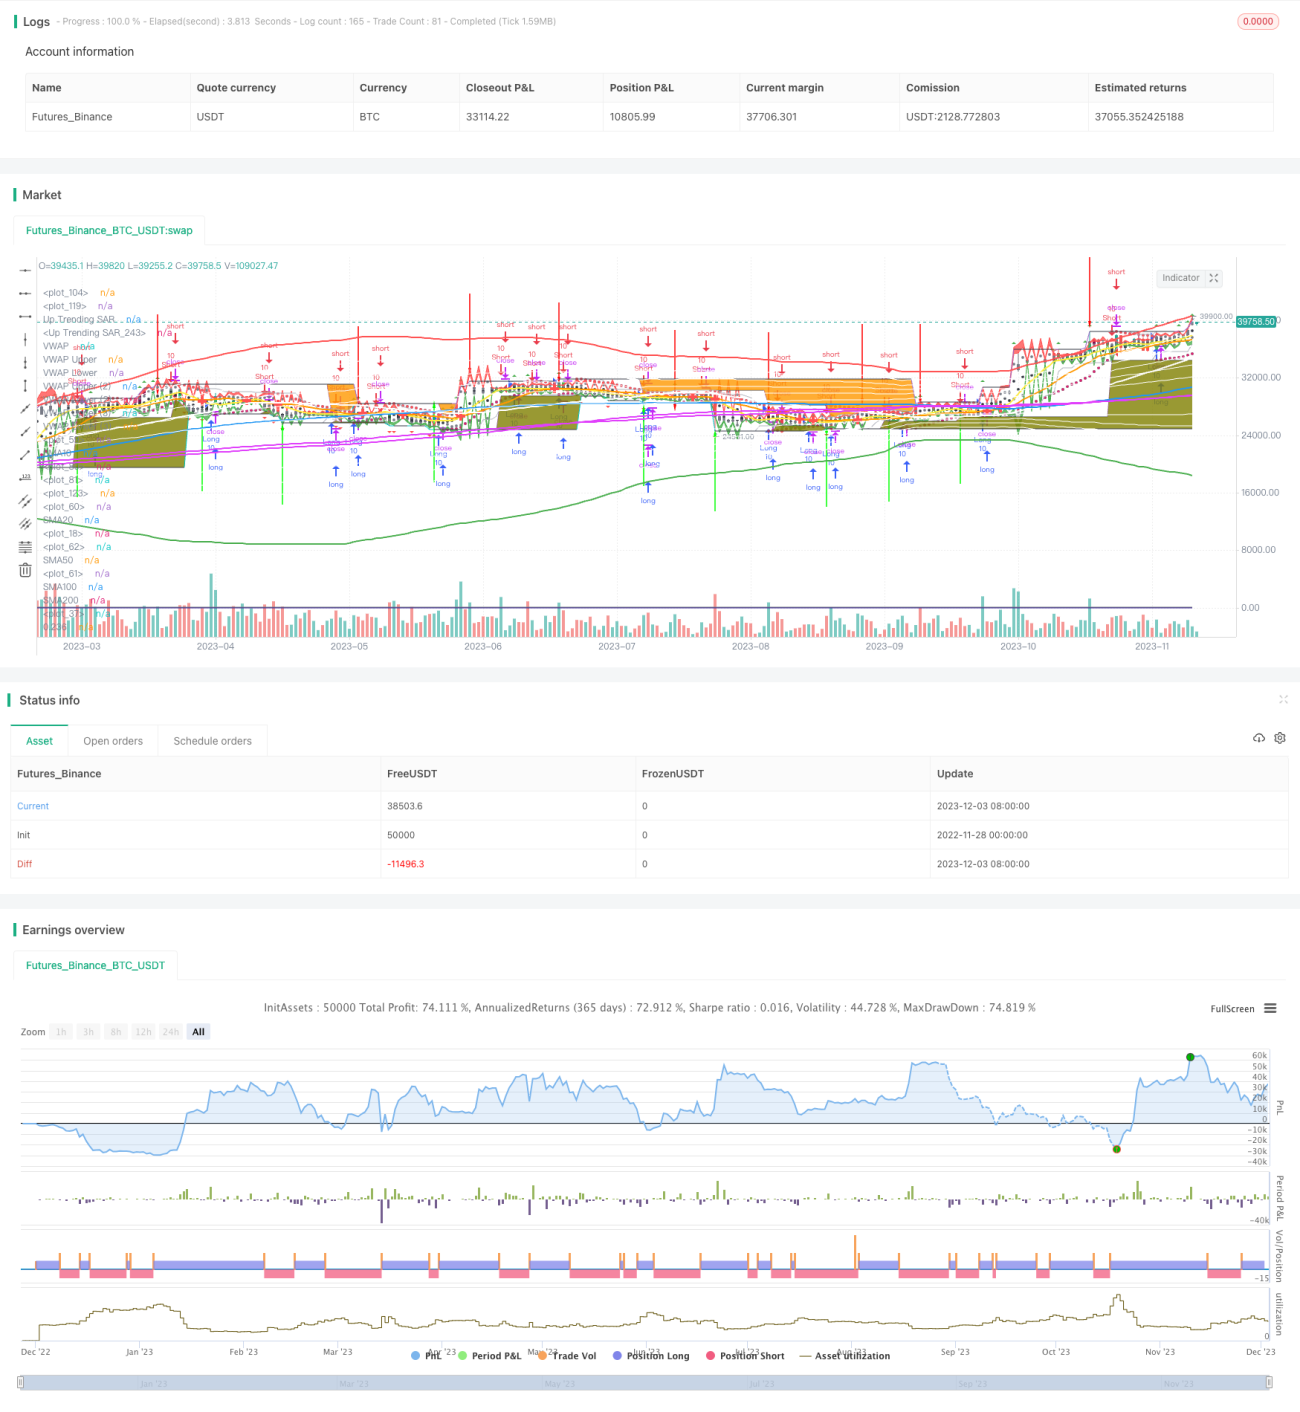
Gambaran keseluruhan
Strategi ini menggabungkan pelbagai alat analisis teknikal seperti purata bergerak, indikator turun naik, harga purata bertimbangan kuantiti yang diperdagangkan (VWAP) dan indikator hentian parasol untuk mewujudkan strategi perdagangan Turtle campuran yang mempunyai keupayaan penembusan yang kuat dan fungsi perlindungan hentian.
Prinsip Strategi
- Menggunakan gabungan garis rata-rata SMA dari pelbagai tempoh untuk menentukan arah trend dan kemungkinan titik pecah
- Penggunaan Indeks Volatiliti Brin untuk menilai keadaan Overbought dan Oversold dalam jangka pendek
- Kawasan harga seimbang yang digunakan untuk menentukan garis tengah dan panjang menggunakan VWAP
- Garis paralisis SAR sebagai penanda berhenti kerugian, mengurangkan kerugian
- Hukum Turtle menghasilkan isyarat beli dan jual
Analisis kelebihan
- Berpaduan pelbagai penunjuk, penilaian lebih menyeluruh, isyarat lebih tepat
- Indeks VWAP membantu menentukan julat harga yang munasabah, mengelakkan mengejar harga yang tinggi secara buta.
- Penunjuk Stop Loss SAR mengawal kerugian setiap kedudukan dengan berkesan
- Hukum Turtle memastikan masa masuk ke kedudukan yang tepat
Analisis risiko
- Tetapan parameter yang tidak betul boleh menyebabkan frekuensi dagangan yang terlalu tinggi atau kesalahan signal
- Satu Stop Loss boleh mengehadkan ruang untuk keuntungan
- Menapis isyarat Turtle dengan betul untuk mengelakkan konflik
Arah pengoptimuman
- Sesuaikan parameter kitaran rata-rata SMA untuk mengoptimumkan pengenalan penembusan
- Menyesuaikan parameter kadar turun naik agar lebih dekat dengan harga
- Optimumkan parameter parallax, hentikan kerosakan lebih tepat
- Menapis isyarat Turtle bersama-sama dengan petunjuk lain
ringkaskan
Strategi ini melalui gabungan organik pelbagai petunjuk, membentuk isyarat perdagangan yang lebih tepat, daya tahan yang lebih kuat, parameter yang lebih banyak ruang penyesuaian strategi jenis Turtle. Setelah parameter disesuaikan dengan betul, keupayaan untuk mengiktiraf dan melindungi penembusan akan ditingkatkan, adalah strategi perdagangan kuantitatif yang disyorkan.
Source
Pine
/*backtest
start: 2022-11-28 00:00:00
end: 2023-12-04 00:00:00
period: 1d
basePeriod: 1h
exchanges: [{"eid":"Futures_Binance","currency":"BTC_USDT"}]
*/

//@version=4
strategy("Gui's Turtle", shorttitle = "Guis Turtles", overlay=true, pyramiding=0, default_qty_value = 10)

//This script has to be used with Heikin Ashi Caddles for the strategy to work wellStrategy parameters
Related strategies
Comment
All comments (0)
No data
- 1