Dagangan kuantitatif strategi panjang dan pendek yang tepat

Gambaran keseluruhan
Artikel ini terutamanya memperkenalkan strategi perdagangan kuantitatif berdasarkan saluran Brin, ADX dalam kombinasi dengan K Line untuk membuat keputusan kosong. Strategi ini menggunakan saluran Brin untuk menilai trend dan turun naik pasaran, dan menggabungkan indikator ADX untuk menilai trend pasaran yang lemah, memilih arah pasaran yang kuat untuk melakukan lebih banyak kosong, dan dalam keadaan yang bergolak, melihat ke arah yang lain, dan mengelakkan risiko sebanyak mungkin.
Prinsip Strategi
-
- Berdasarkan laluan Brin atas dan bawah arah trend pasaran. Harga terletak di atas laluan atas sebagai perdagangan bertopeng, terletak di bawah laluan bawah sebagai perdagangan kosong.
-
- Blink channel bandwidth mencerminkan turun naik dan risiko pasaran. Lebih lebar Blink channel bandwidth menunjukkan bahawa pasaran semakin bergolak, lebih besar risiko, dan anda harus mengelakkan meletakkan kedudukan.
-
- Indikator ADX menilai trend pasaran kuat atau lemah. Nilai ADX lebih besar daripada 25 menunjukkan trend trend, yang menentukan arah Bollinger Bands memilih arah untuk membina kedudukan. ADX kurang daripada 25 menunjukkan pergerakan goyah, yang harus dihindari.
-
- Selepas membuat keputusan untuk melakukan lebih banyak arah shorting, menetapkan titik hentian berdasarkan petunjuk ATR. ATR digunakan untuk mengukur ketinggian turun naik pasaran, menetapkan jarak hentian berdasarkan kelipatan ATR.
-
- Hentian dipasang mengikut Brin di atas dan di bawah landasan. Hentian berbilang kepala dipasang di bawah landasan, hentian kosong dipasang di atas landasan. Atau jarak berhenti tetap ditetapkan berdasarkan ATR kali ganda ATR.
-
- Menguruskan keuntungan dan kerugian di antara titik henti dan titik berhenti, dan menetapkan henti bergerak untuk mengunci keuntungan.
Kelebihan Strategik
-
Gabungan dengan laluan Brin dan arah penghakiman ADX, dapat menilai dengan jelas kelebihan ruang dan membuat pilihan pilihan, mengelakkan perdagangan yang tidak berguna dalam keadaan yang bergolak.
-
Menggunakan lebar jalur Brin untuk menilai risiko kadar turun naik, peluang tinggi apabila lebar jalur Brin sempit tetapi risiko rendah. Elakkan berdagang apabila lebar jalur Brin meluas.
-
Tetapan ATR Stop Loss membolehkan risiko terkawal, dan meminimumkan kemungkinan Stop Loss dikejar.
-
Berdasarkan tetapan laluan Brin, tidak ada risiko untuk berhenti mengejar tinggi atau berhenti mengejar rendah.
-
Hentian bergerak memastikan keuntungan dan terus mengikuti trend selepas berhenti tepat pada masanya.
Risiko Strategik
-
Terdapat kemungkinan tekanan pada kedua-dua saluran Brin dan ADX. Jika berlaku perpindahan, ia boleh menyebabkan kesalahan penghakiman.
-
Indeks ATR hanya boleh mencerminkan turun naik sejarah dan tidak dapat meramalkan turun naik masa depan.
-
Kawasan Brin Corridor adalah subjektif, dan peluang mungkin terlepas.
-
Hentian bergerak hanya boleh dilakukan di dalam cakera, terdapat risiko tidak dapat bergerak dalam jangka masa yang singkat.
-
Risiko penyesuaian data. Laporan ujian sukar ditiru dalam pasaran sebenar.
Pengoptimuman Strategi
-
Mengintegrasikan lebih banyak penunjuk untuk saling mempercayai, mengelakkan isyarat palsu dari saluran Brin dan penunjuk ADX.
-
Hentian ATR boleh ditambah dengan hentian melompat. Atau hentian yang ditetapkan untuk meramalkan turun naik pasaran menggunakan algoritma pembelajaran mendalam.
-
Mengoptimumkan parameter laluan Burin untuk membolehkannya menerima peluang pasaran yang lebih besar.
-
Menggunakan sistem perdagangan berprogram yang lebih cekap untuk menghentikan kerugian bergerak tanpa pengawal.
-
Ujian semula dilakukan pada jangka masa yang lebih lama dan lebih banyak kombinasi varieti untuk memastikan strategi ini stabil.
ringkaskan
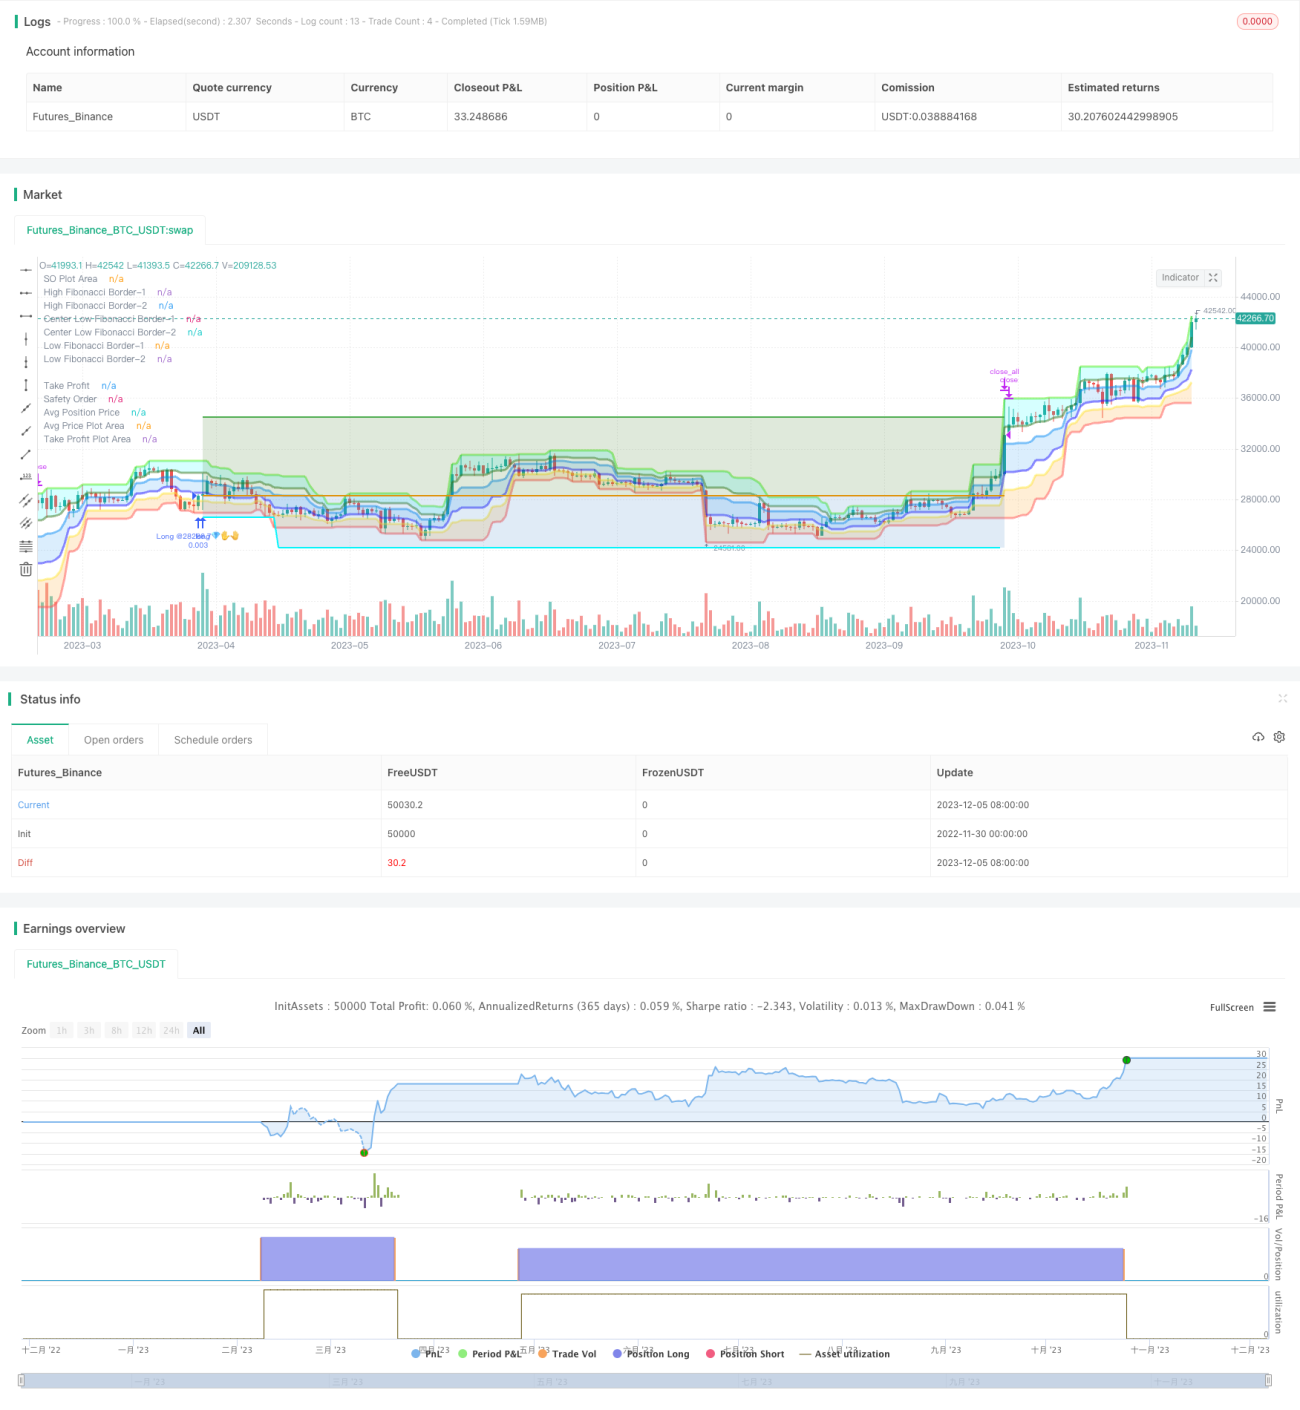
Strategi ini mengintegrasikan beberapa isyarat indikator seperti saluran Brin, indikator ADX, membuat pilihan pilihan selepas menentukan arah trend yang jelas, dan menggunakan indikator ATR untuk mengoptimumkan tetapan stop loss, meminimumkan risiko dan kadar keuntungan, adalah strategi perdagangan kuantitatif yang disyorkan. Kami melihat banyak ruang untuk pengoptimuman strategi ini, menanti keluaran versi generasi akan datang.
/*backtest
start: 2022-11-30 00:00:00
end: 2023-12-06 00:00:00
period: 1d
basePeriod: 1h
exchanges: [{"eid":"Futures_Binance","currency":"BTC_USDT"}]
*/

// © Fibonacci Zone DCA Strategy - R3c0nTrader ver 2022-06-12
// For backtesting with 3Commas DCA Bot settings
// Thank you "eykpunter" for granting me permission to use "Fibonacci Zones" to create this strategy
// Thank you "junyou0424" for granting me permission to use "DCA Bot with SuperTrend Emulator" which I used for adding bot inputs, calculations, and strategy- 1